From Slow Query to Root Cause: Snowflake Performance Debugging with DinoAI
Your Snowflake query is slow. Finding out exactly why normally means context-switching between Query Profile, your SQL editor, and your dbt™️ model — before you've written a single fix. DinoAI's Snowflake Query Analysis Tool compresses that diagnostic loop into a single prompt: give it a query ID, tell it what to investigate, and get a structured diagnosis with concrete recommendations without leaving the Paradime IDE.

Fabio Di Leta
·
6
min read

Your Snowflake query is slow. You know something is wrong — maybe it's a spill problem, maybe the warehouse is undersized, maybe a full partition scan is blowing up execution time. But getting from "this query is slow" to "here's exactly what to fix" normally means pulling up the Query Profile UI, reading through a wall of operator-level stats, and triangulating across phase timings, spill metrics, and warehouse utilization — all before you've written a single line of fix.
DinoAI's Snowflake Query Analysis Tool compresses that diagnostic loop into a single prompt. Give it a query ID. Tell it what you're investigating. Get a structured analysis with concrete recommendations — without leaving the Paradime IDE.
What the Tool Actually Does
The Snowflake Query Analysis Tool takes a Snowflake query ID and returns a structured performance report that DinoAI can reason over directly. It's not a wrapper around QUERY_HISTORY — it fetches operator-level execution plan statistics, the kind you'd normally dig through in Snowflake's Query Profile UI.
Specifically, it surfaces:
Phase timings — how long each stage of query execution took
Warehouse usage and resource consumption — what your warehouse was actually doing
Cache efficiency — whether results or metadata were served from cache
Row counts and partition details — to identify full scans and pruning failures
Spill metrics — local and remote spill, the most common culprits behind unexpectedly slow queries
Queue times — to distinguish between "query ran slowly" and "query waited to run"
Operator-level statistics — from the full execution plan
The distinction between queue time and execution time alone saves significant debugging time. A query that spent 45 seconds queued and 8 seconds executing isn't a query optimization problem — it's a warehouse sizing or concurrency problem. The tool makes that separation explicit.
Note: The Snowflake Query Analysis Tool is focused on query-level debugging. For exploring warehouse metadata or running exploratory SQL, use the Warehouse Tool or SQL Execution Tool instead.
The traditional debugging flow looks something like this:
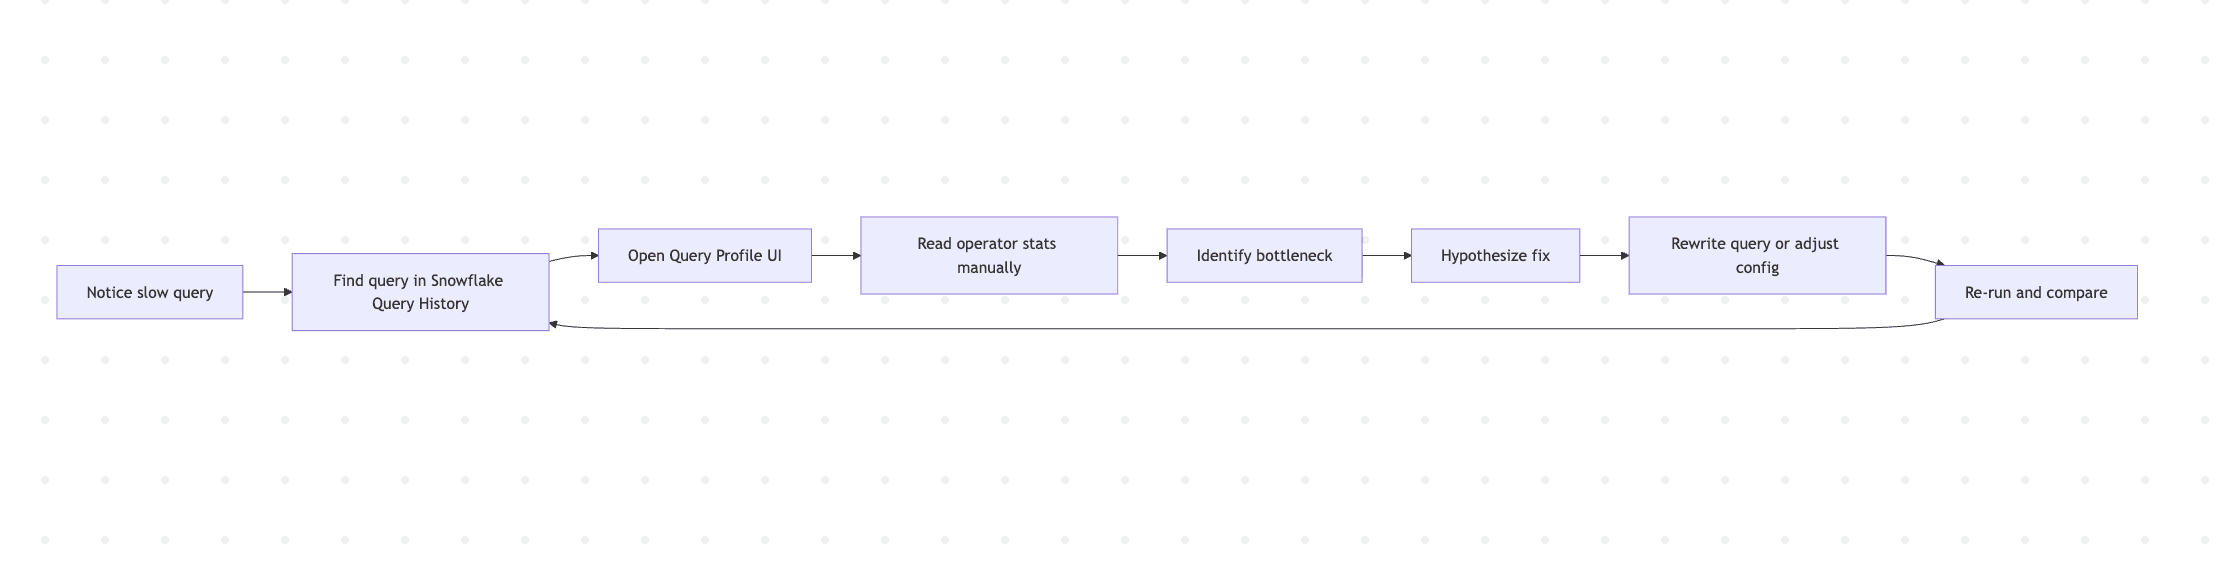
Every cycle through that loop is manual context-switching: Snowflake UI → SQL editor → dbt™ model → back to Snowflake. With DinoAI, it collapses:
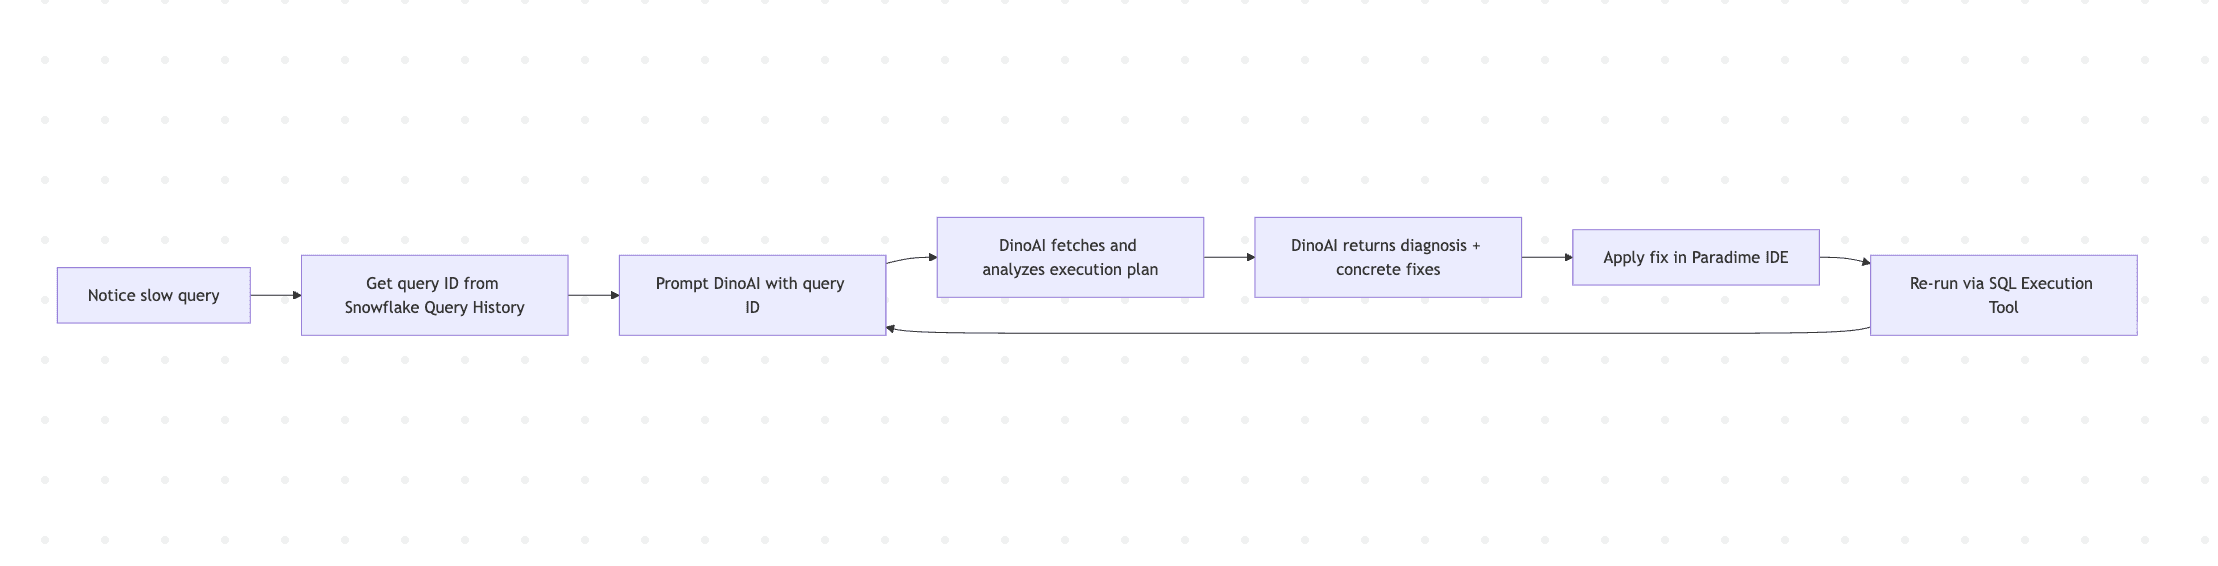
The iteration loop shortens because diagnosis and implementation happen in the same place.
Workflow 1: Diagnosing a Slow dbt™ Model Run
You run dbt build and a specific model takes 4 minutes when it used to take 30 seconds. Something changed — maybe the underlying data volume, maybe a join condition, maybe an upstream schema shift. Start with the query ID from Snowflake's Query History under Activity → Query History.
DinoAI fetches the execution plan, identifies which operators consumed the most time, checks whether partition pruning is working, and returns both an explanation and rewrite suggestions you can apply directly in your dbt™ model file.
If the issue turns out to be a missing clustering key rather than a SQL problem, DinoAI will surface that too — along with the specific column that would benefit from clustering based on the filter predicates in the query.
Workflow 2: Distinguishing Warehouse Contention from Query Inefficiency
Queue time buried in an execution profile is easy to overlook when you're focused on operator stats. A query that looks inefficient might actually be fine — it just waited too long to start.
DinoAI reads the queue and execution time breakdown and tells you directly: is this a concurrency problem (more queries competing than the warehouse can handle), an undersized warehouse (not enough resources per query), or a genuine query inefficiency? Each diagnosis leads to a different fix — auto-scaling policy changes, warehouse resizing, or query rewriting — and DinoAI distinguishes between them rather than returning a generic "optimize your SQL" response.
Workflow 3: Tracking Down Spill Problems
High local or remote spill is one of the most common causes of slow Snowflake queries and one of the hardest to diagnose by reading SQL alone. Spill happens when intermediate results exceed the available memory in a warehouse node, forcing data to be written to local disk (local spill) or remote storage (remote spill). Remote spill in particular can slow a query by an order of magnitude.
DinoAI returns the spill metrics broken down by operator, identifies which join, aggregation, or sort is producing the spill, and recommends targeted fixes: rewriting the join order, adding a filter to reduce intermediate cardinality, increasing warehouse size for memory-intensive workloads, or restructuring the dbt™ model to pre-aggregate before the expensive operation.
Workflow 4: Validating a Performance Fix
Optimization is an iteration loop. You make a change, re-run the query, and check whether things actually improved. The Snowflake Query Analysis Tool, combined with the SQL Execution Tool, closes that loop inside the IDE.
DinoAI fetches both execution profiles, compares them across the key dimensions — execution time, partitions scanned, cache hit rate, spill — and tells you whether the change had the intended effect and whether there are remaining bottlenecks worth addressing.
Workflow 5: Full Debug Loop — Slow Query to Committed Fix
For more involved investigations, DinoAI can chain the Snowflake Query Analysis Tool with its other capabilities to take a slow query all the way to a committed code change.
DinoAI works through this sequentially: fetch and analyze the execution plan → identify the issue → edit the model file via the File System Tool → validate with Terminal (dbt compile or dbt build) → commit via Git. The result is a branch with a documented performance fix, tracing directly back to the Snowflake query data that motivated it.
A Few Things Worth Knowing
Get the query ID from Query History, not the SQL editor. Snowflake's Query History under Activity → Query History shows the exact query ID for any execution. The format is a UUID like 01c2a115-0002-e622-0002-731a0090040a. Using the right ID ensures DinoAI is analyzing the actual execution you're concerned about, not a cached or differently-compiled version.
Tell DinoAI what you suspect. The more specific your prompt, the more targeted the analysis. "Analyze this query" returns a broad report. "Focus on spill metrics and partition pruning" returns a diagnosis aimed at the most likely culprits. Both are useful — specificity just gets you there faster.
Iterate on the query ID after each fix. Performance optimization only works if you verify the change. Re-run the query after each modification and analyze the new query ID. DinoAI can compare two query IDs directly if you provide both.
Spill is worth checking by default. Even if you're not specifically investigating a spill problem, asking DinoAI to include spill metrics in every analysis surfaces issues that wouldn't otherwise be obvious from execution time alone. A query can be fast enough to pass review while still spilling locally — and local spill becomes remote spill at higher data volumes.
Combine with the Warehouse Tool for table context. When partition pruning is the issue, the Warehouse Tool can surface clustering key information and table metadata to inform whether the fix is a SQL change or a table reconfiguration.
Getting Started
The Snowflake Query Analysis Tool is available inside DinoAI's Agent Mode in the Paradime Code IDE right panel. No additional setup is required beyond a connected Snowflake account.
Full tool docs: Snowflake Query Analysis Tool · SQL Execution Tool · Warehouse Tool · Agent Mode
Related reading: From Google Workspace to dbt™ Code: AI Workflows with DinoAI
FAQ
What is the Snowflake Query Analysis Tool? It's a DinoAI tool that fetches detailed execution plan statistics for a given Snowflake query ID and lets DinoAI reason over them to diagnose performance issues and suggest fixes — without leaving the Paradime IDE.
Where do I find a Snowflake query ID? In the Snowflake UI under Activity → Query History. The query ID is the UUID shown for any historical query execution.
What's the difference between the Snowflake Query Analysis Tool and the SQL Execution Tool? The Query Analysis Tool diagnoses an existing execution by its ID — it reads what already happened. The SQL Execution Tool runs new SQL against your warehouse. They're complementary: use Analysis to diagnose, Execution to validate a fix.
Can DinoAI fix the dbt™ model automatically after diagnosing the issue? Yes, when running in Agent Mode. DinoAI can identify the issue, edit the model file, run dbt compile or dbt build to validate, and commit the change to a branch — all from a single chained prompt.
What Snowflake performance issues can DinoAI diagnose? Slow execution phases, warehouse contention, poor partition pruning, cache misses, local and remote spill, operator-level bottlenecks, and queue time versus execution time breakdowns.


