Accelerate Analytics Development with Paradime and Tableau
For analytics engineers, the gap between data transformation and business intelligence can be a minefield of broken dashboards, unexpected downtime, and frustrated stakeholders. Paradime's Tableau integration bridges this divide with a sophisticated solution that enables faster development cycles while dramatically reducing the risk of production incidents.

Kaustav Mitra
·
5
min read
In today's data-driven business landscape, analytics teams face mounting pressure to deliver insights faster while maintaining quality and governance. The integration between modern data transformation tools and business intelligence platforms has become critical for success. For organizations leveraging Tableau's powerful visualization capabilities alongside dbt™️ for data transformation, Paradime offers a comprehensive suite of features that streamlines the entire analytics development lifecycle—from code to dashboard.
The Business Intelligence Landscape
According to Ramp's vendor analysis, business intelligence platforms remain essential investments for data-driven organizations, with companies spending an average of $87,000 annually on BI tools across their tech stack.
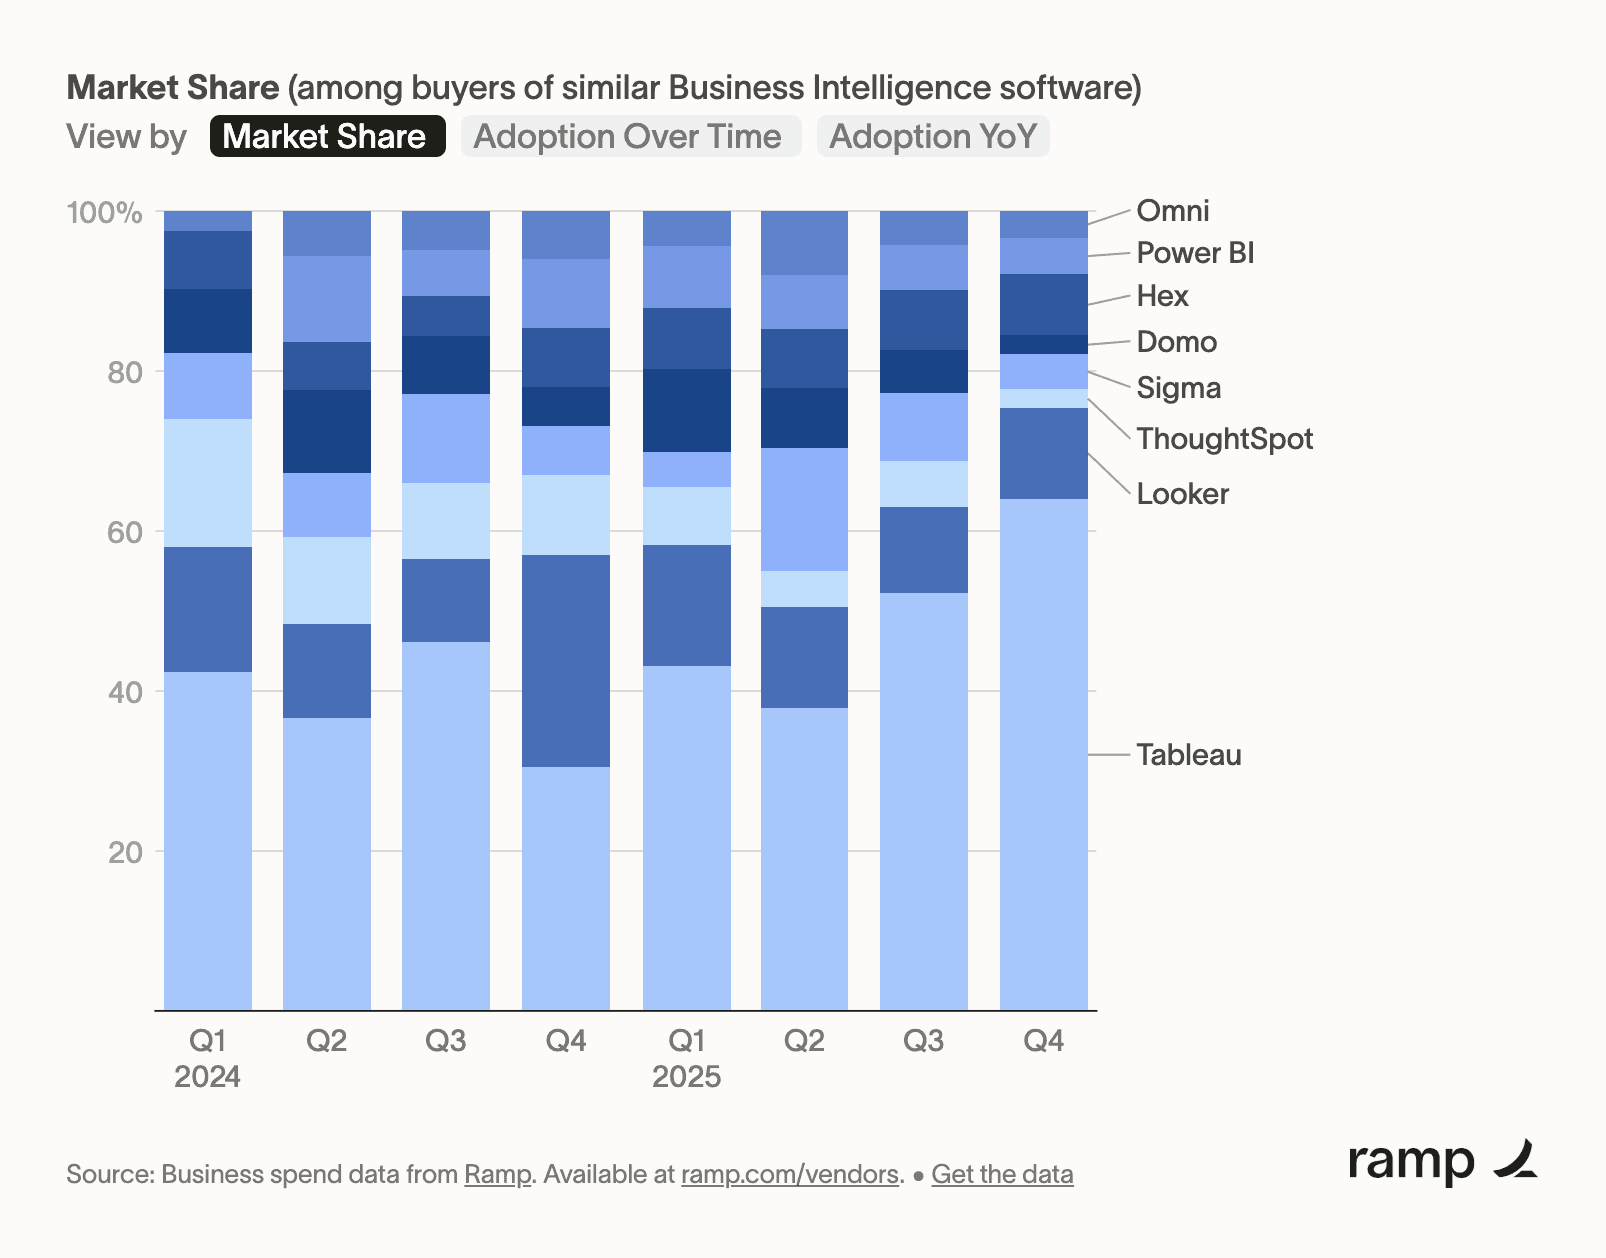
Figure 1: Business Intelligence category insights showing market trends and spending patterns, Source: https://ramp.com/vendors/categories/business-intelligence
Tableau, as one of the leading BI solutions, serves over 86,000 companies globally with an average contract value of $15,000. The platform's strength lies in its intuitive visual analytics capabilities, enabling users across technical skill levels to explore and understand data.
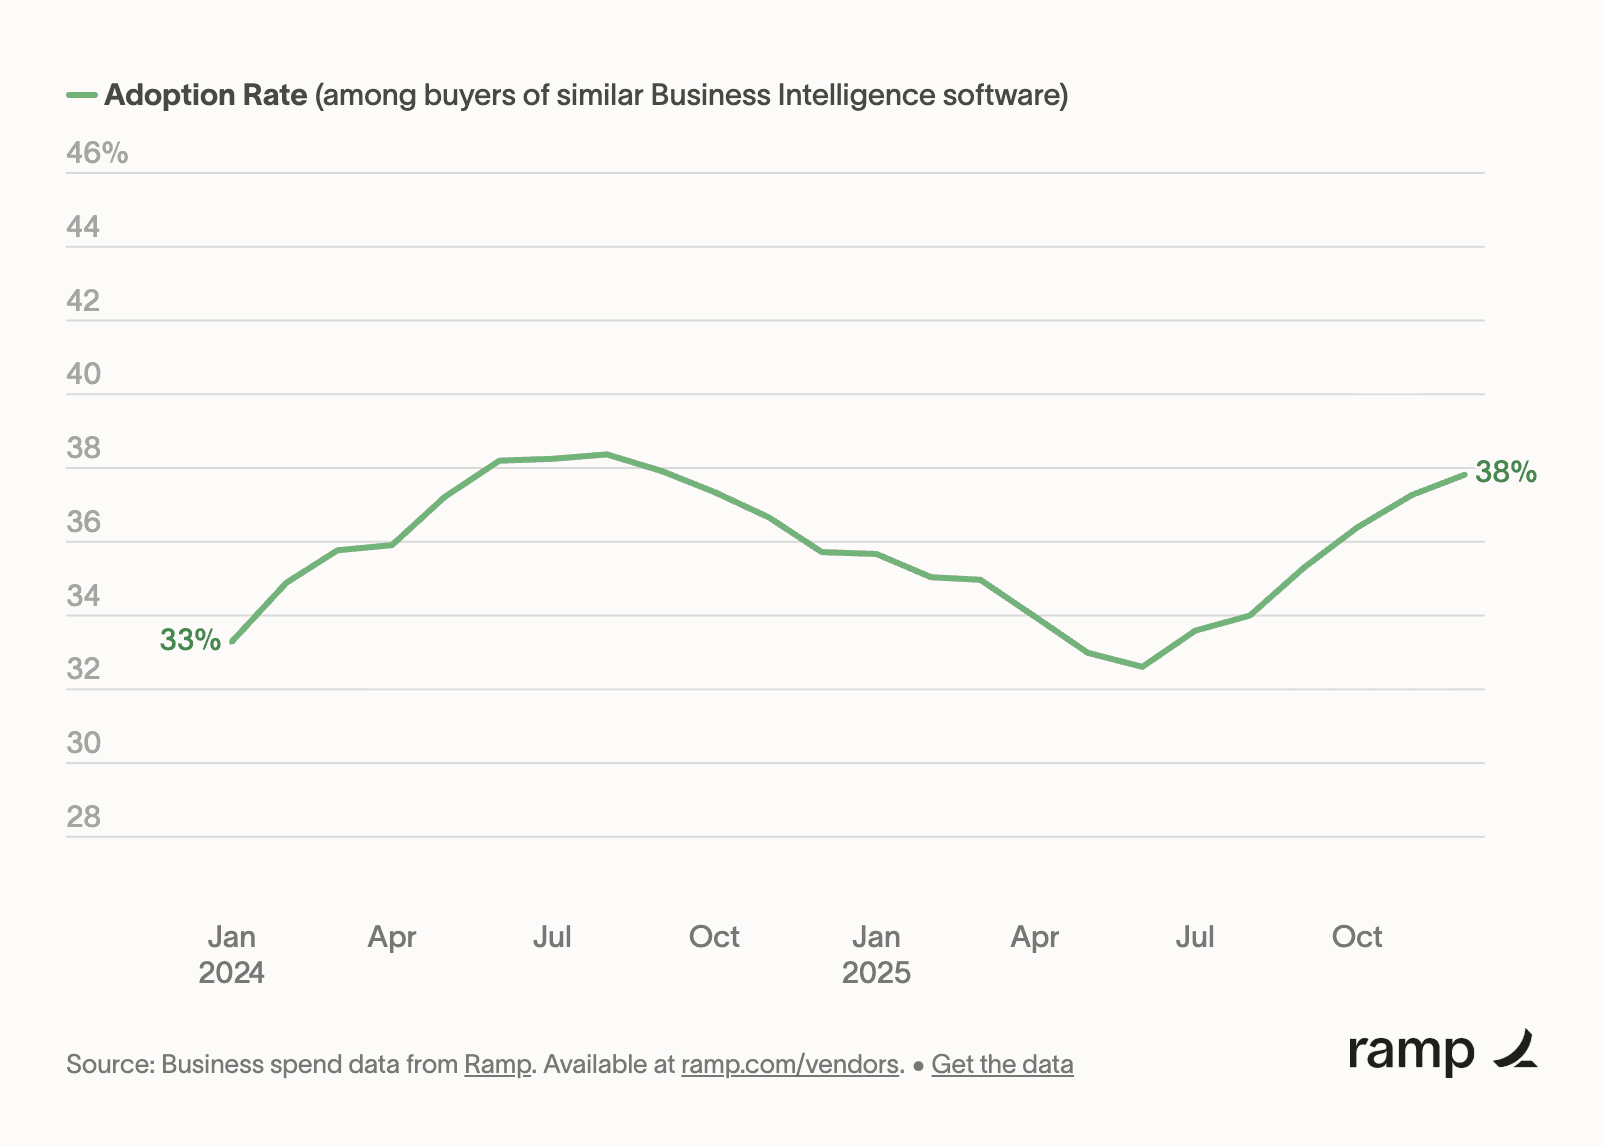
Figure 2: Tableau's market presence and customer base statistics. Source: https://ramp.com/vendors/tableau
However, Tableau's effectiveness depends heavily on the quality and reliability of underlying data pipelines. This is where the integration with modern data stack tools becomes invaluable. Organizations using Tableau alongside dbt™️ report significant efficiency gains when they implement proper orchestration, lineage tracking, and impact analysis capabilities—exactly what Paradime delivers.
Understanding Data Flow with Paradime Lineage
One of the most powerful features of the Paradime-Tableau integration is comprehensive lineage visualization. Lineage tracking answers a fundamental question that analytics teams face daily: "What will be affected if I change this data model?"
Paradime's lineage feature provides end-to-end visibility from your dbt™️ models all the way to Tableau dashboards. This means you can see exactly which dashboards and data sources depend on specific dbt™️ models, enabling informed decision-making before making changes.
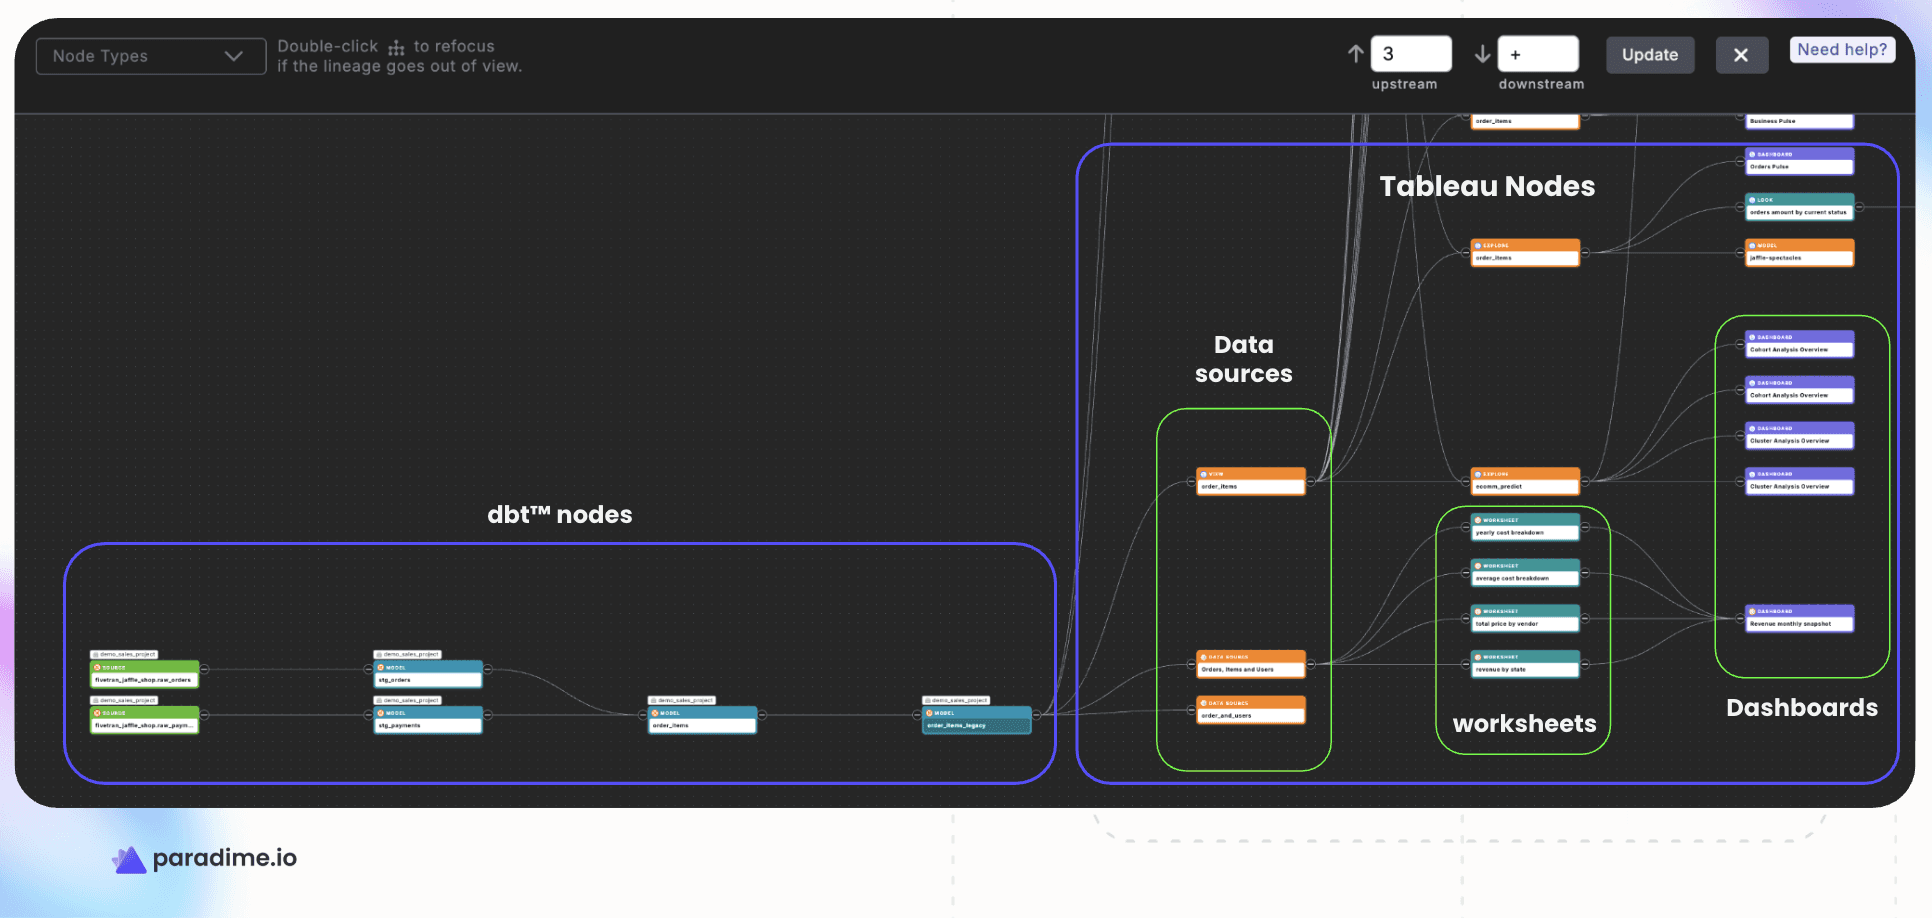
Figure 3: End-to-end data lineage from dbt™️ models to Tableau dashboards
Within Paradime's Code IDE, you can access lineage preview directly through the command panel. Simply select a model and view its downstream dependencies, including any connected Tableau workbooks or data sources. This real-time visibility eliminates guesswork and reduces the risk of breaking production dashboards with upstream changes.
CI/CD Integration: Catch Breaking Changes Before Production
Paradime's Bolt CI/CD framework takes lineage analysis a step further with automated impact detection. When you open a pull request that modifies dbt™️ models, Bolt automatically generates a lineage diff that highlights which Tableau assets will be affected by your changes.
Column-Level Lineage Diff in Action
Consider a common scenario: you're refactoring a customer dimension table and decide to rename customer_lifetime_value to customer_ltv for consistency. Without column-level lineage, this seemingly simple change could break multiple Tableau dashboards without warning.
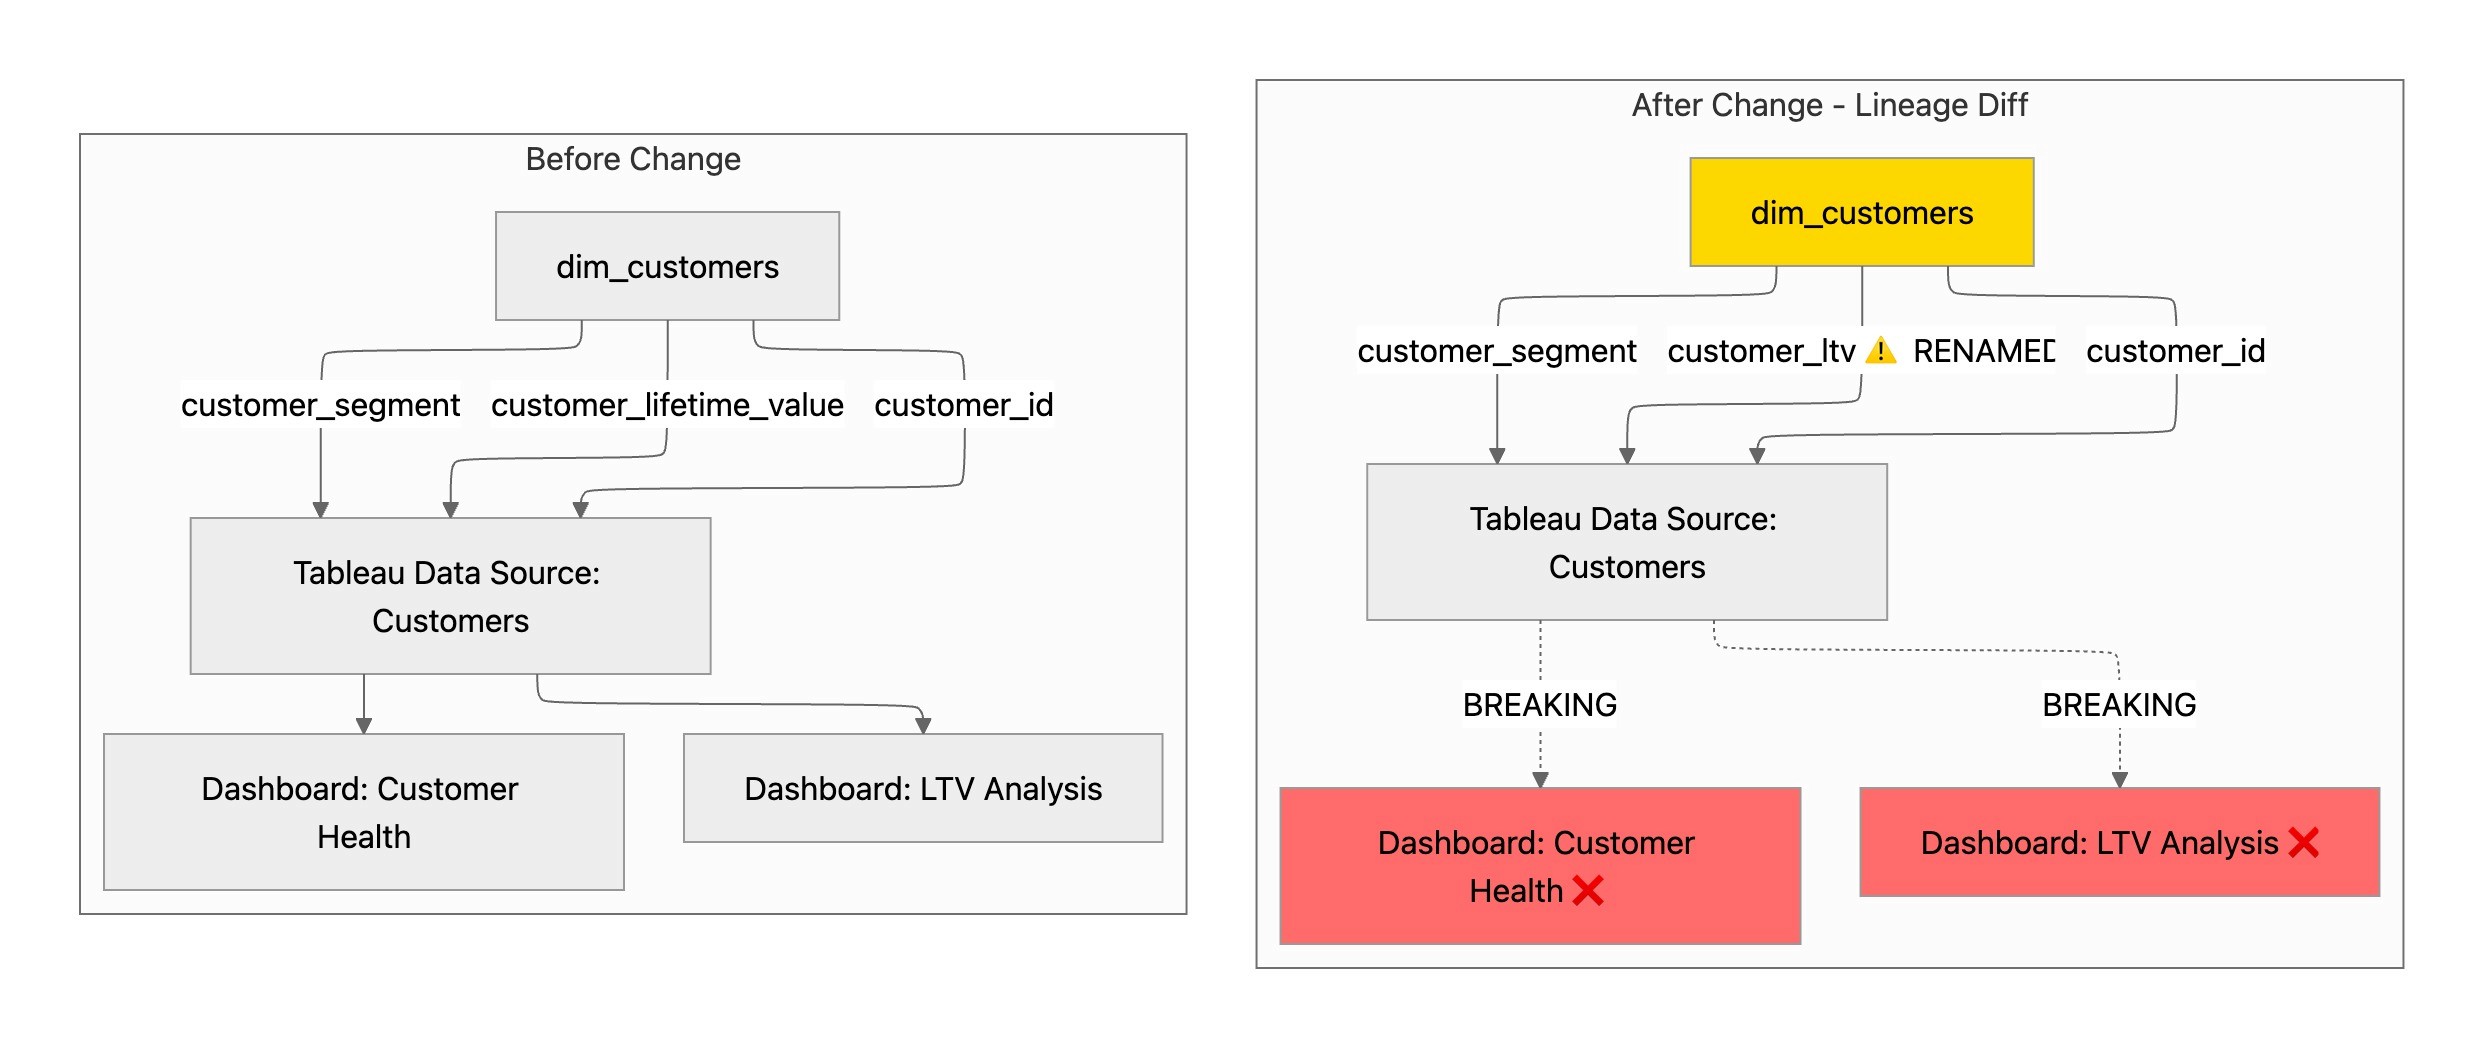
Figure 4: Paradime and Tableau Column-level lineage diff - before and after change
The lineage diff immediately surfaces that:
Two Tableau dashboards reference the renamed column
The "Customer Health" dashboard uses
customer_lifetime_valueThe "LTV Analysis" dashboard has five charts dependent on this field
Both dashboards will break upon deployment
This pre-deployment analysis operates as an early warning system. If your PR removes a column that feeds into a C-suite revenue dashboard, you'll know before merging—not after deployment when executives are reporting discrepancies. The lineage diff appears directly in your pull request, enabling code reviewers to assess both technical correctness and business impact simultaneously.
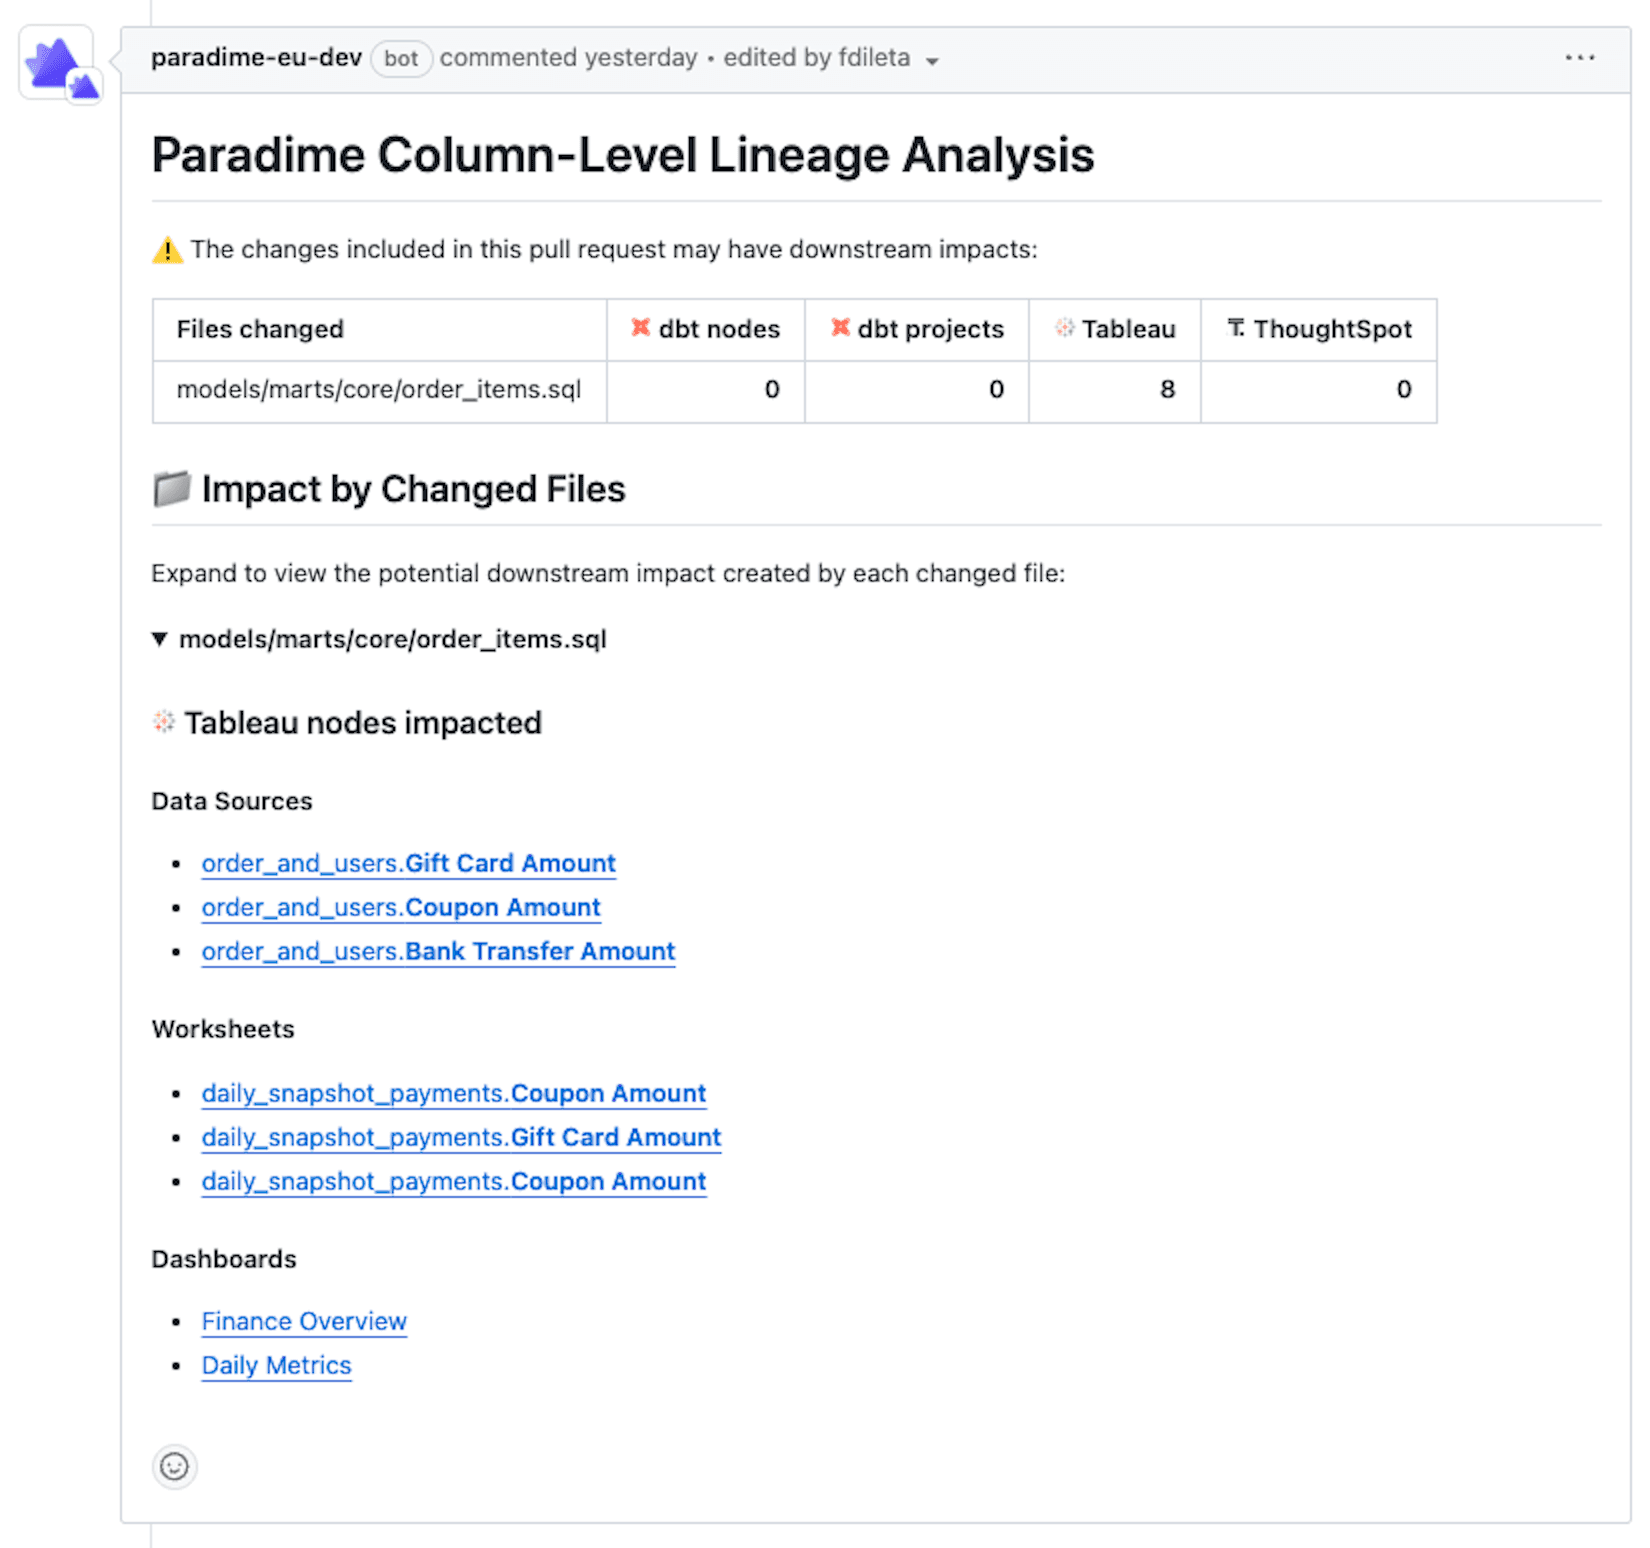
Figure 5: Paradime and Tableau Column-level lineage diff - pull request
Complete Impact Visibility
Here's how column-level lineage diff tracks changes through the entire pipeline:
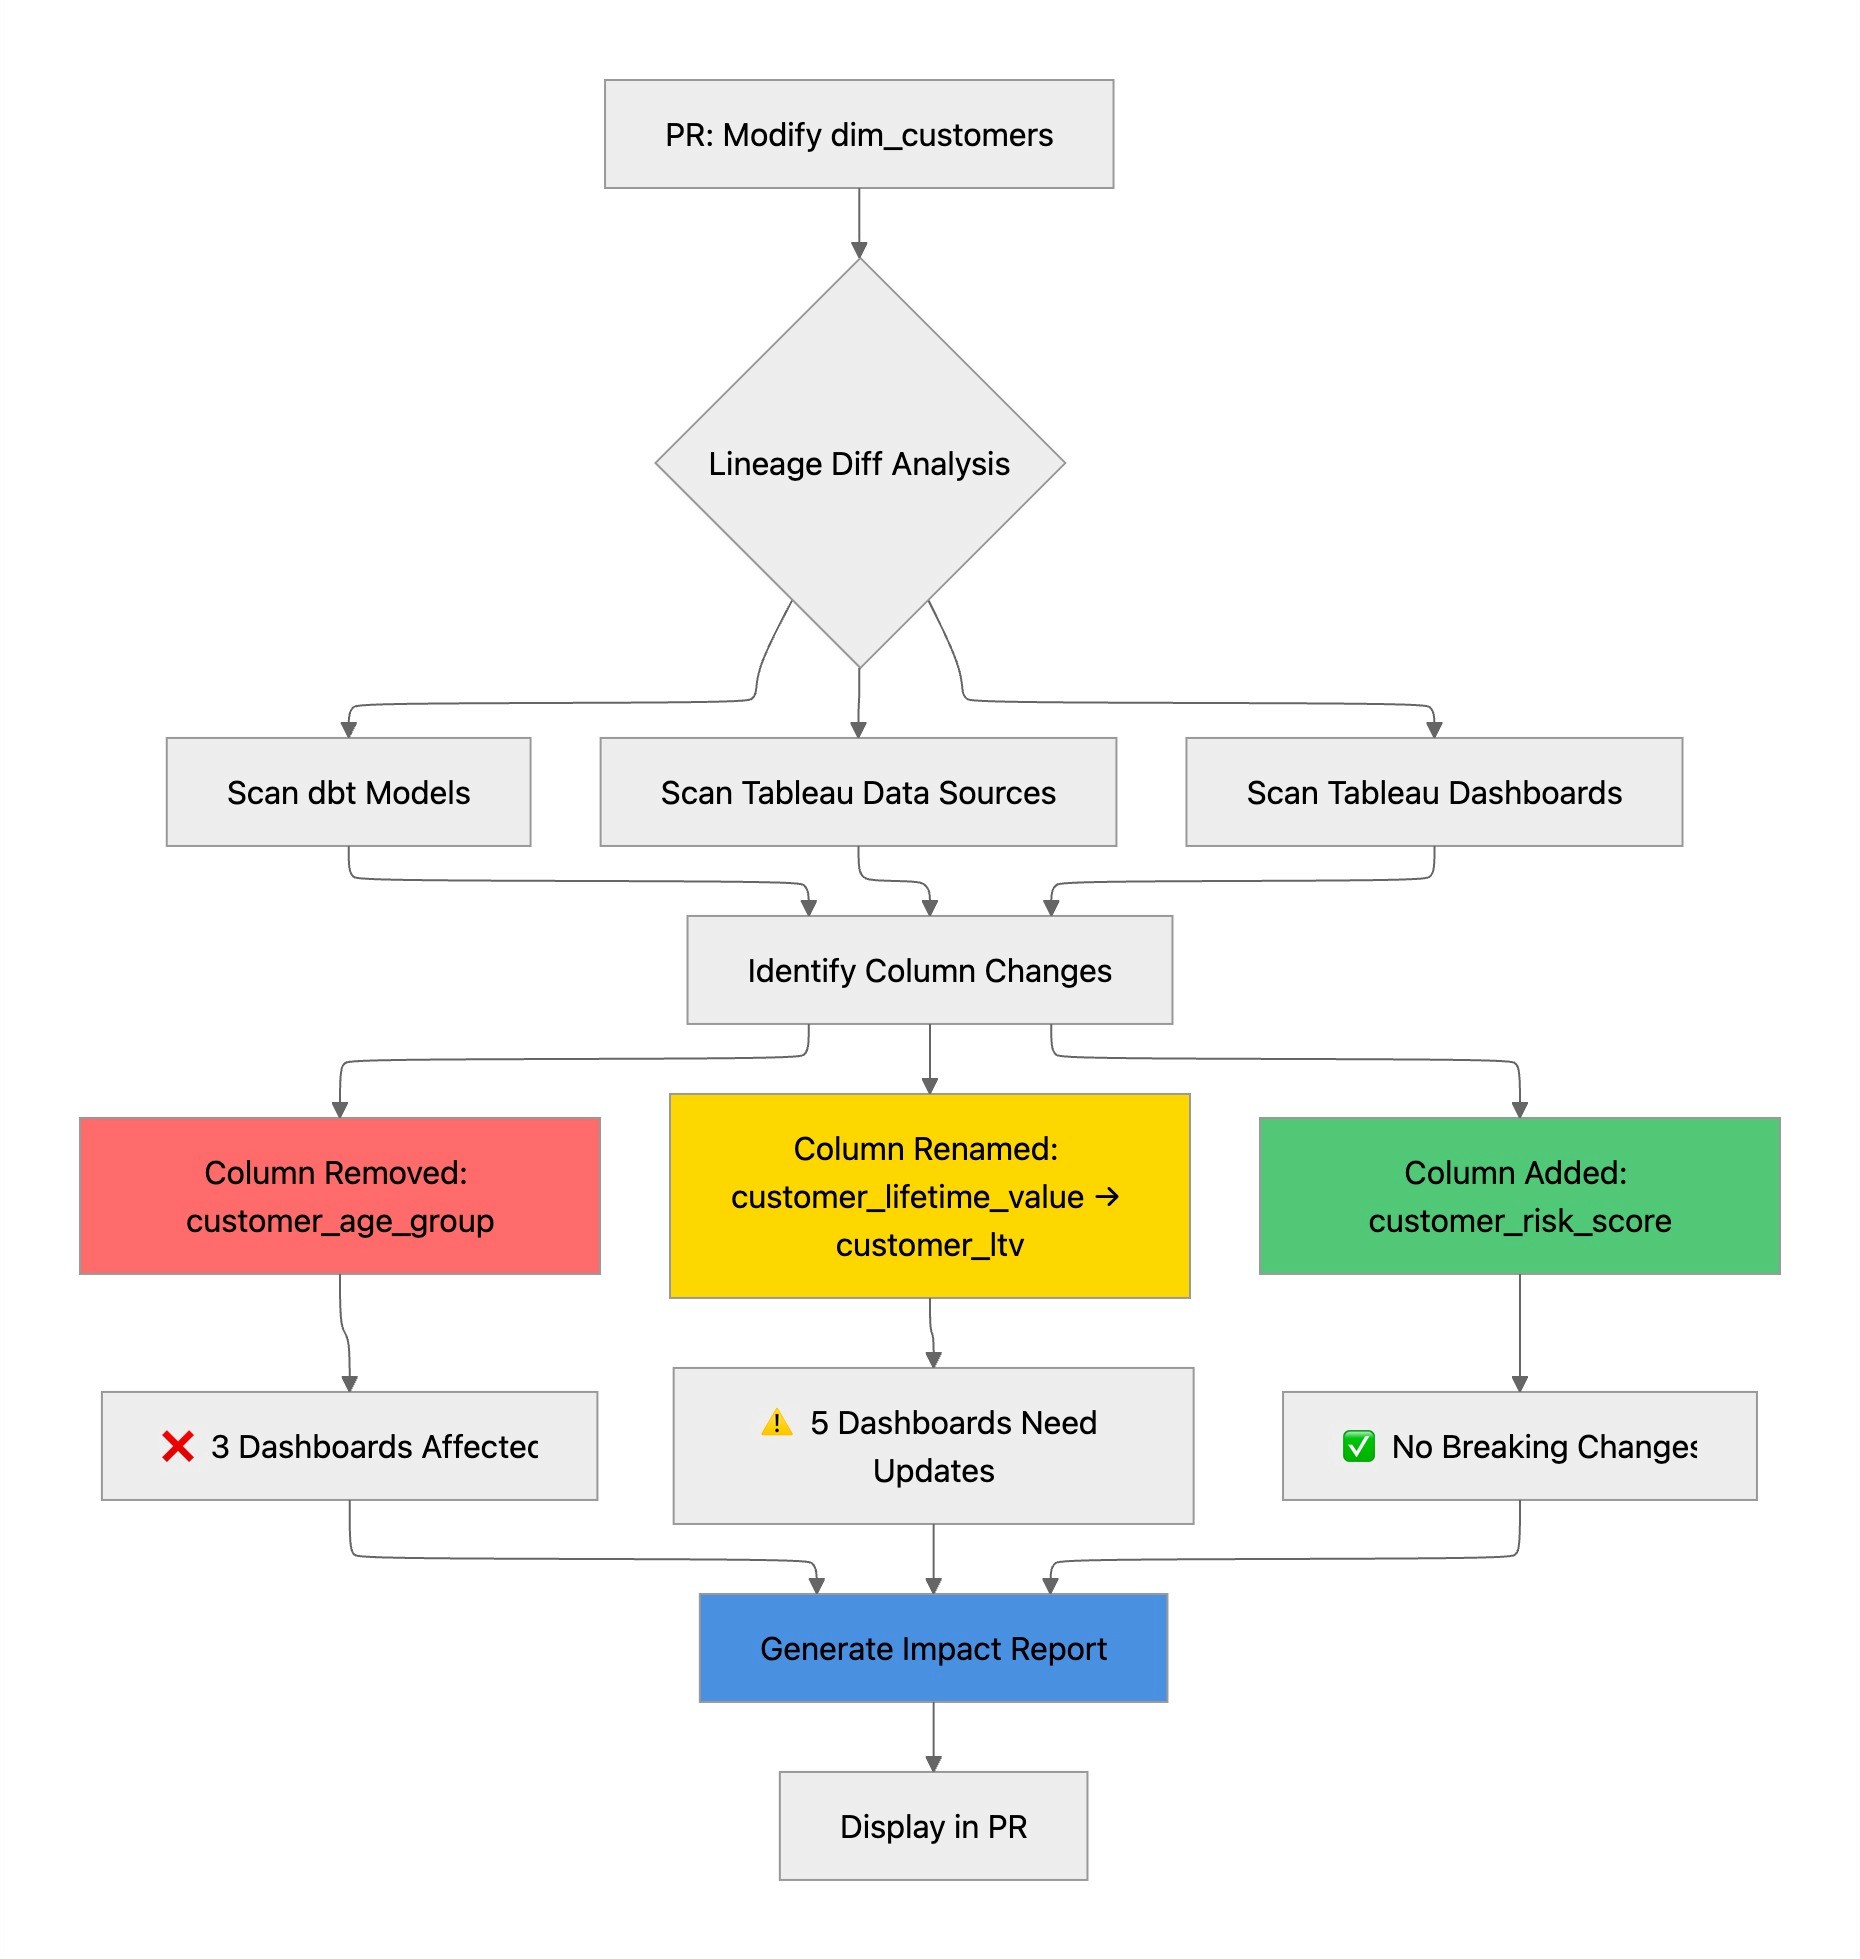
Figure 6: Paradime and Tableau Column-level lineage diff process
The Development Velocity Advantage
The productivity gains from Paradime's Tableau integration compound across three dimensions:
Faster Debugging: When a Tableau dashboard breaks, tracing the issue back through multiple transformation layers can consume hours. Paradime's lineage graph provides instant root cause analysis, showing exactly which dbt™️ model change triggered the downstream failure.
Confident Refactoring: Technical debt accumulates when teams fear touching legacy code. With complete visibility into Tableau dependencies, analytics engineers can refactor confidently, knowing they've accounted for every downstream impact.
DinoAI Advantage: Keeping dbt™️ models and Tableau data sources in sync is a common problem. But clever users are now using DinoAI’s built-in column-level lineage context to generate impact assessment reports as part of pull requests whenever dbt™️ models change.
Preventing Inadvertent Downtime
The most valuable aspect of Paradime's Tableau integration isn't what it enables—it's what it prevents. Every organization has experienced the cascade of problems that follows an unexpected dashboard outage: emergency meetings, hurried rollbacks, eroded trust in data systems.
Paradime's integration creates multiple guardrails against these incidents. The lineage preview catches issues during development, the CI/CD diff catches them during code review, and the comprehensive dependency tracking ensures that no downstream asset goes unaccounted for.
Automated Dashboard Refreshes with Paradime Bolt
Maintaining fresh data in Tableau dashboards requires coordination between data transformation jobs and BI refresh schedules. Paradime Bolt eliminates this coordination overhead by orchestrating both your dbt™️ runs and Tableau refreshes in a single, unified workflow.
Bolt supports two types of Tableau refresh operations:
Workbook Refreshes: Trigger complete workbook refreshes after your dbt™️ models complete. This ensures that dashboards always reflect the latest transformed data, maintaining consistency across your analytics stack.
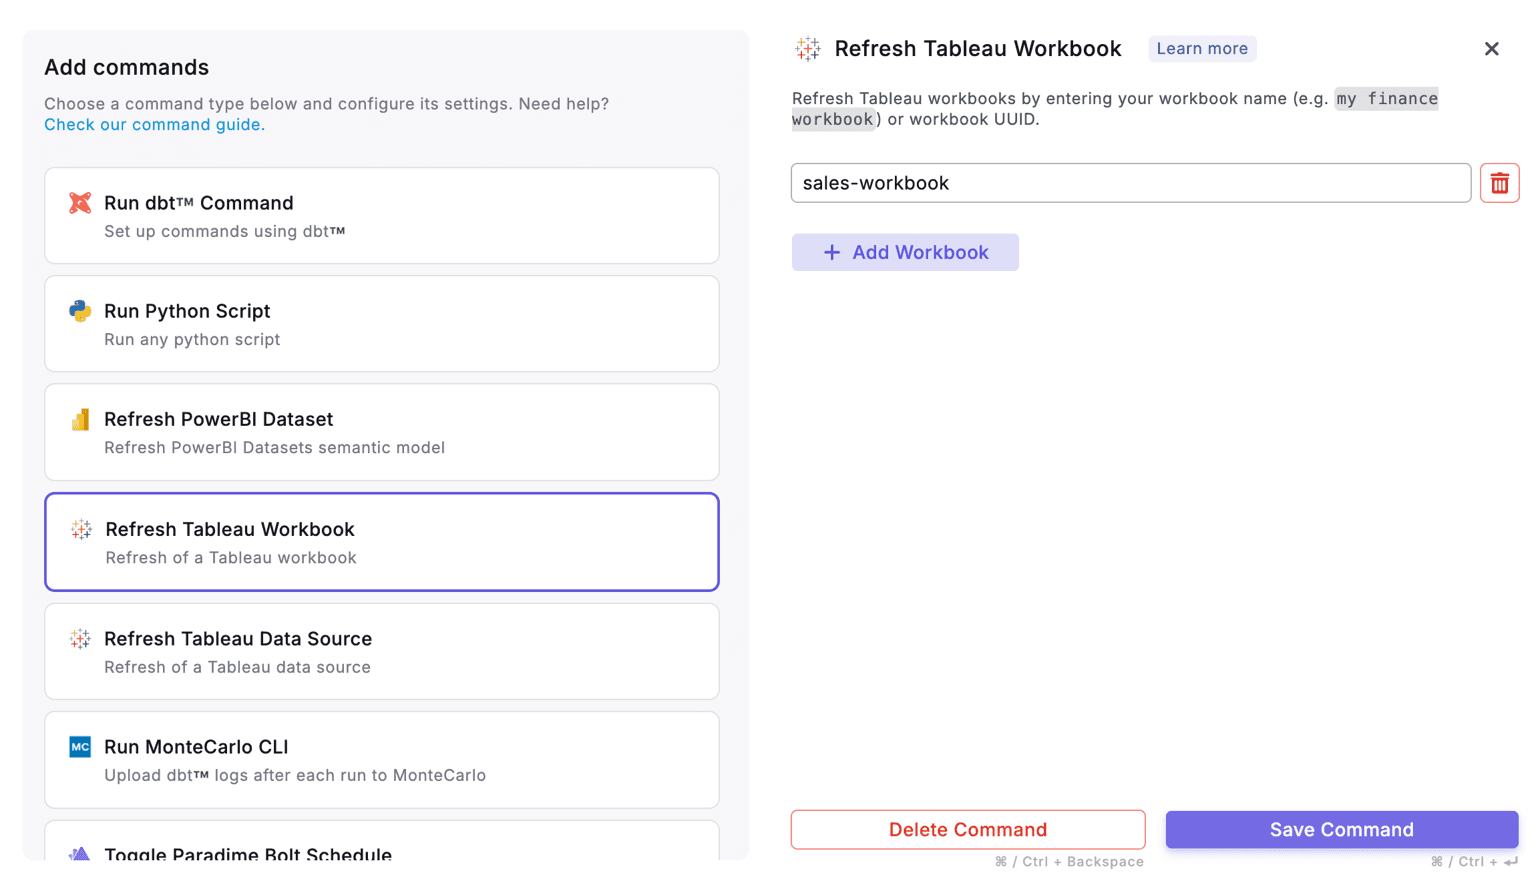
Figure 7: Configuring Tableau workbook refresh in Paradime Bolt schedules
Data Source Refreshes: For organizations with published data sources, Bolt can trigger extract refreshes independently. This is particularly useful when multiple workbooks share the same data source, as you can refresh once and update all dependent dashboards efficiently.
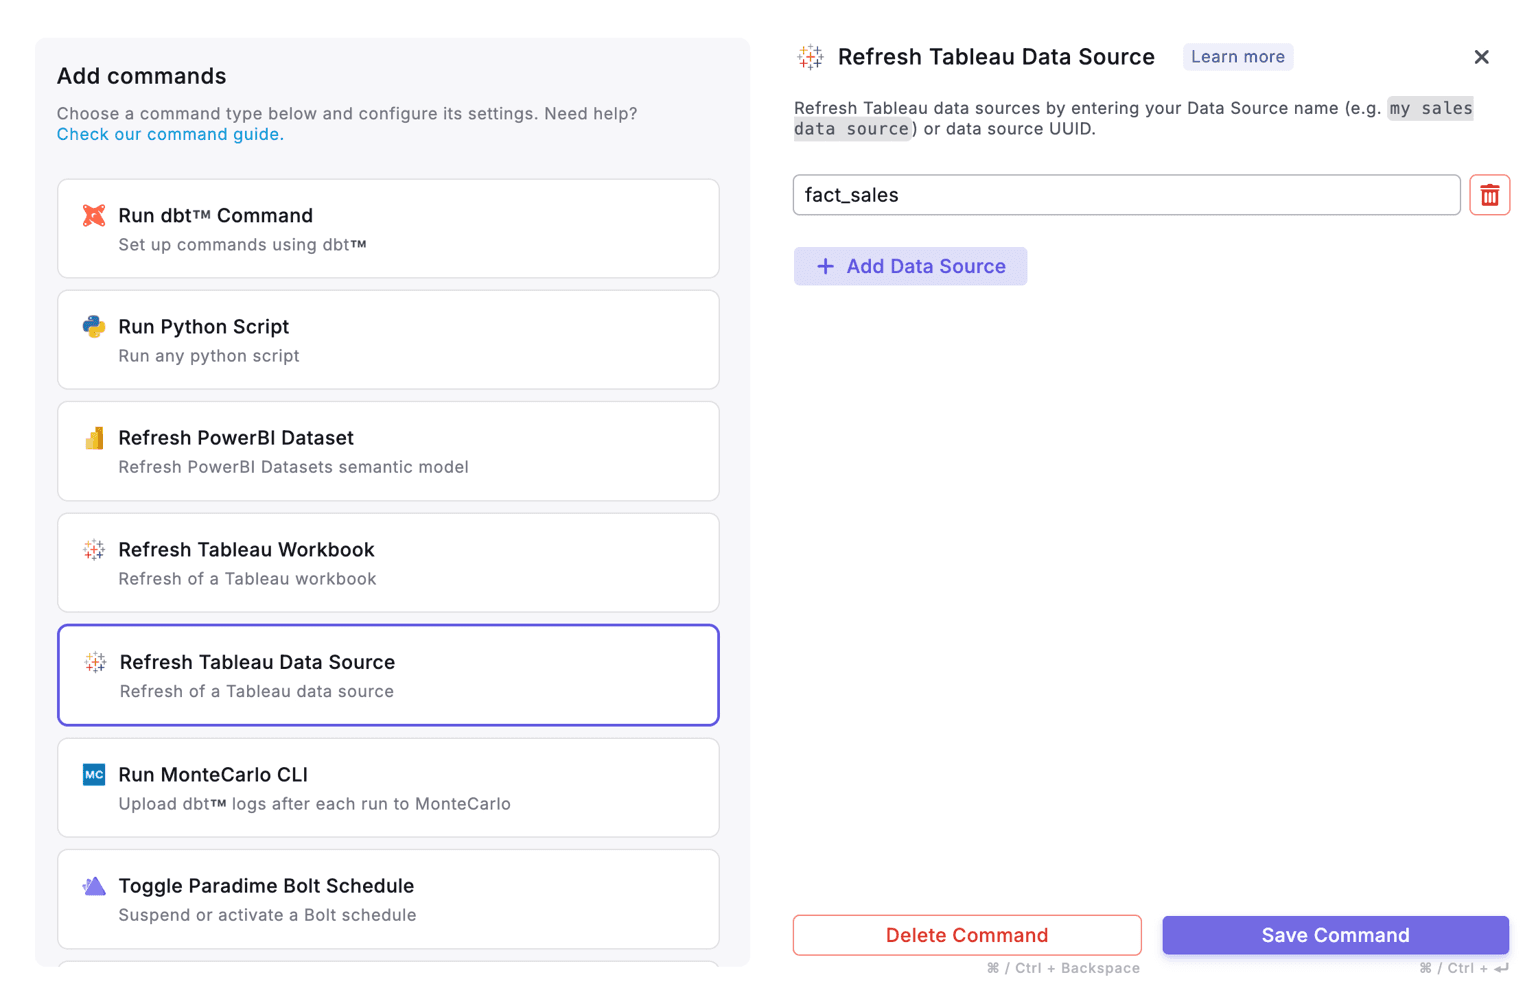
Figure 8: Setting up Tableau data source refresh commands in Bolt
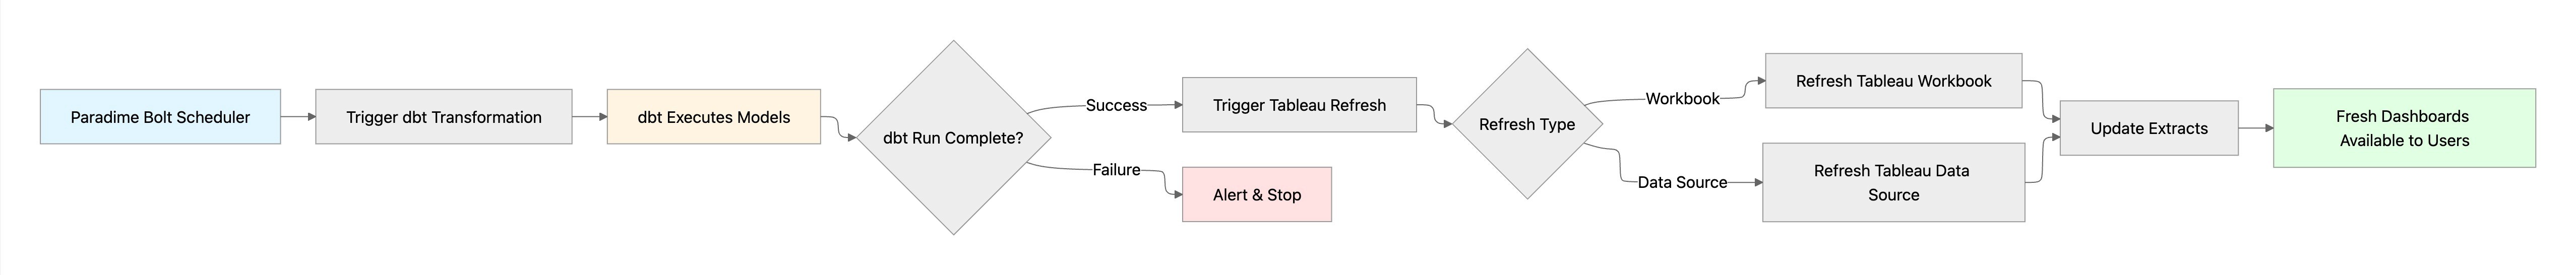
Figure 9: Automated orchestration flow from dbt™️ to Tableau dashboard updates
Setting up these refreshes is straightforward through the Paradime interface. After connecting your Tableau instance, you can configure refresh commands within your Bolt schedules, specifying which workbooks or data sources to update and defining dependencies to ensure proper execution order.
Conclusion
The integration between Paradime and Tableau represents a significant advancement in analytics engineering efficiency. By combining comprehensive lineage tracking, precise impact analysis, and automated orchestration, teams can move faster while maintaining the governance and quality standards that stakeholders expect.
Whether you're preventing breaking changes with column-level lineage diff, understanding dependencies through visual lineage, or automating dashboard refreshes with Bolt, Paradime transforms how analytics teams work with Tableau. The result is fewer production incidents, faster development cycles, and greater confidence in your analytics infrastructure.
To get started, connect your Tableau instance to Paradime through the integrations settings and begin experiencing the benefits of a truly unified analytics development platform.


