Introduction
Paradime is an AI-powered workspace that consolidates the entire analytics workflow, eliminating tool sprawl across VSCode, dbt Cloud™, Airflow, and monitoring platforms. With features like DinoAI for intelligent SQL generation, Paradime Bolt for production-grade orchestration, and column-level lineage tracking, data teams experience 10x acceleration in analytics engineering and 50-83% productivity improvements. Companies like Emma and MyTutor have achieved 50% efficiency gains and 100% uptime across 400+ hourly models, while reducing warehouse spending by 20%+ through intelligent query optimization.
Understanding Paradime Radar Real-Time Alerting
What is Paradime Radar?
Paradime Radar is a powerful real-time intelligence suite designed to help data teams monitor and optimize their data operations with instant notifications for critical events. As part of the Paradime platform, Radar focuses on proactive issue management across job performance, cost spikes, and data quality concerns.
Key Benefits of Real-Time Alerts
Speed: Configure each alert in under 20 seconds
Cost Savings: Achieve 3% additional savings from detecting costly and timed-out queries
Reliability: 90% on-time notification delivery across all channels
Proactive Management: Act immediately when issues arise to prevent SLA misses and budget overruns
Multi-Channel Notification System
Paradime Radar supports three primary notification channels to ensure your team receives alerts wherever they work:
Slack: Real-time alerts delivered directly to team channels
Microsoft Teams: Integrated notifications for enterprise environments
Email: Traditional alerting for non-chat-based workflows
Setting Up Alerts in Paradime Radar
Prerequisites
Before configuring your first alert, ensure you have:
Paradime Radar Plan subscription (alerts are exclusive to Radar Plan users)
Completed Real-Time Alerting setup in Radar's Get Started guide
Configured notification channels (Slack, MS Teams, or email)
Alert Configuration Process
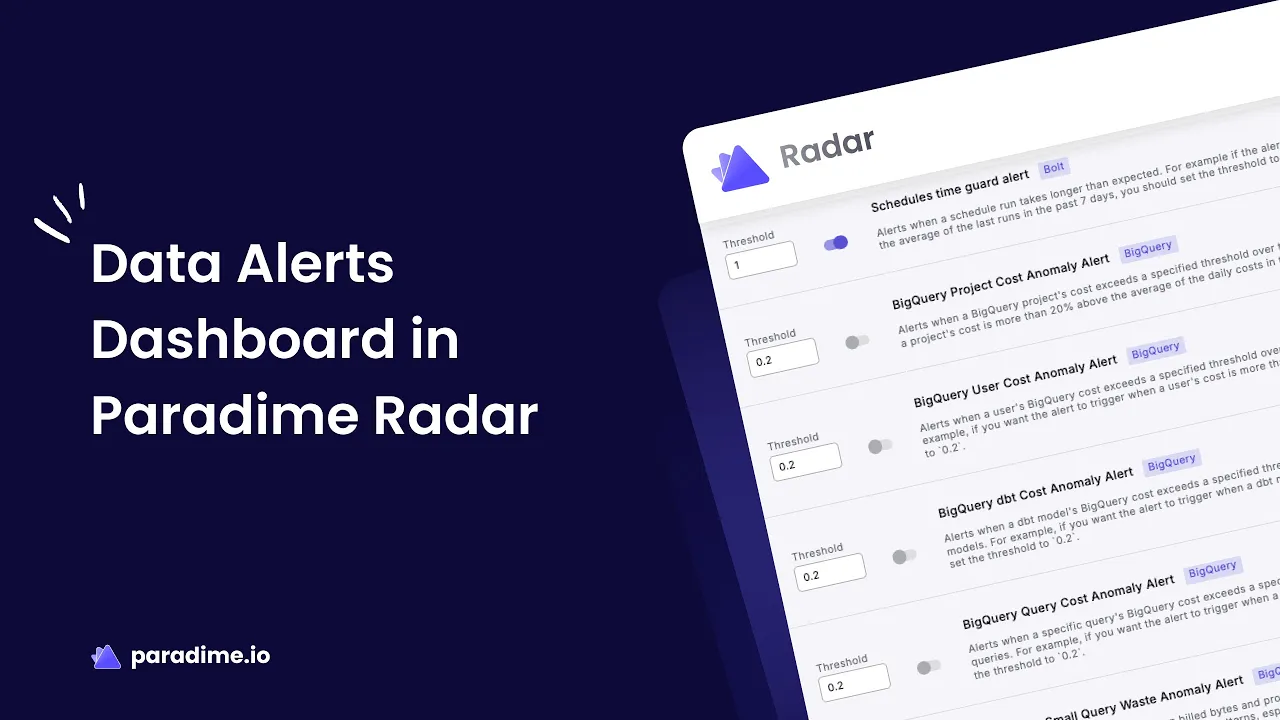
Navigate to Data Alerts Section: Access the Radar dashboard and locate the Data Alerts configuration area
Select Alert Type: Choose from Snowflake or BigQuery-specific alerts based on your data warehouse
Set Threshold Values: Configure percentage thresholds (e.g., 20% for cost anomalies means alerts trigger when costs exceed 20% above the 7-day average)
Define Minimum Values: Set absolute value thresholds to reduce noise from insignificant fluctuations
Enable Alert: Toggle the switch to activate the alert
All thresholds must be set between 0-1 for valid configurations. The threshold represents the percentage deviation from baseline metrics—a 20% threshold triggers when metrics exceed 20% above normal, while a 50% threshold allows for more significant deviations.
Snowflake Alert Types
Cost Anomaly Alerts
Monitor spending patterns across your Snowflake environment with five critical cost alerts:
Project Cost Anomaly Alert tracks overall project spending patterns with a recommended 20% threshold, helping detect unexpected spikes in total costs that could indicate runaway queries or inefficient processes.
User Cost Anomaly Alert monitors the top 10 most costly users at a 20% threshold, identifying individuals running expensive queries that require optimization.
dbt Cost Anomaly Alert flags the top 10 most costly dbt models when execution costs increase by 20%, catching models that may need refactoring.
Query Cost Anomaly Alert tracks the top 10 most expensive individual queries at a 20% threshold, catching expensive ad-hoc or report queries consuming excessive resources.
Warehouse Compute Cost Anomaly Alert monitors warehouse-level spending at 20%, detecting when specific warehouses experience cost spikes due to increased workload or inefficiency.
Performance Anomaly Alerts
Query Remote Spillage Ratio Anomaly Alert identifies the top 10 queries spilling to remote storage when spillage reaches 5x baseline levels. Remote spillage significantly slows query performance and increases costs, making this alert critical for maintaining optimal performance.
BigQuery Alert Types
Cost Monitoring Alerts
BigQuery offers four essential cost monitoring alerts:
Project Cost Anomaly Alert monitors overall BigQuery project costs at a 20% threshold, tracking total spending across all queries and jobs.
User Cost Anomaly Alert identifies the top 10 most expensive users when spending increases by 20%, helping target users who need query optimization guidance.
dbt Cost Anomaly Alert flags the top 10 most costly dbt models at a 20% threshold, catching models consuming excessive BigQuery slots or processing large data volumes.
Query Cost Anomaly Alert tracks the top 10 most expensive individual queries at 20%, detecting queries scanning unnecessary data or lacking proper filters.
Efficiency and Performance Alerts
Small Query Waste Anomaly Alert catches patterns of many small queries at a 5% threshold that should be batched or consolidated, addressing inefficient application patterns that add up to significant waste.
High Shuffle Spill Anomaly Alert monitors the top 10 queries with highest shuffle spill at 20%, identifying queries needing optimization through better joins, partitioning, or clustering.
Query Runtime Anomaly Alert detects queries running 50% slower than normal, indicating data growth or performance degradation.
Query Slot Usage Anomaly Alert tracks the top 10 queries with highest slot consumption at 50%, identifying queries monopolizing compute resources and potentially impacting other workloads.
Best Practices for Real-Time Alerting
Start Conservative, Then Refine
Begin with recommended thresholds (typically 20%), monitor alert frequency for 1-2 weeks, then adjust based on false positive rates and team capacity.
Prioritize Critical Alerts
Enable cost anomaly alerts first to prevent budget overruns, add performance alerts for user-facing queries, then implement data quality alerts after cost and performance are stable.
Reduce Alert Fatigue
Set minimum absolute value thresholds to filter insignificant alerts, configure alerts for top N resources rather than everything, and route different alert types to appropriate team channels.
Notification Channel Strategy
Create dedicated Slack channels for different alert types (#data-alerts-critical, #data-alerts-cost), integrate Microsoft Teams with existing DevOps workflows, and reserve email for critical alerts requiring immediate attention or for stakeholders who need visibility outside chat tools.
Responding to Common Alert Scenarios
Cost Spike Alerts
When a dbt model cost increases 40% overnight, check recent code changes, review data volume growth in source tables, examine query execution plans, and verify warehouse sizing. Common solutions include adding incremental processing, implementing proper filtering and partitioning, optimizing joins, and scheduling large jobs during off-peak hours.
Performance Degradation Alerts
When query runtime alerts show 60% slower execution, compare current vs. historical execution plans, check data volume growth, verify warehouse availability, and review concurrent query load. Solutions include updating table statistics, implementing clustering or partitioning strategies, scaling warehouses temporarily, and optimizing query logic.
Resource Waste Alerts
When small query waste increases by 8%, identify patterns in usage, review application code calling the database, check for unnecessary polling, and analyze whether queries can be batched. Implement query result caching, batch multiple queries, use materialized views, and review application architecture for efficiency.
Optimizing Warehouse Costs
Snowflake Optimization
Right-size warehouses based on workload requirements, implement auto-suspend and auto-resume settings, use multi-cluster warehouses for variable workloads, and separate production and development environments. Leverage query result caching, implement clustering keys for large tables, and use materialized views for frequently accessed aggregations.
BigQuery Optimization
Choose between on-demand and reserved capacity based on usage patterns, monitor slot utilization, and use flex slots for predictable batch workloads. Partition tables by commonly filtered columns, implement clustering for large tables, use column selection instead of SELECT *, and set table expiration for temporary data.
Real-Time Alerting ROI
Paradime Radar delivers quantifiable benefits: 3% additional savings from catching costly queries early, 20%+ reduction in overall warehouse spending through proactive optimization, and alerts configurable in under 20 seconds with 90% on-time delivery.
Track Mean Time to Detection (MTTD), Mean Time to Resolution (MTTR), cost avoidance from prevented spending, incident reduction over time, and stakeholder satisfaction to demonstrate ROI.
Conclusion
Paradime Radar's real-time alerting capabilities provide data teams with proactive monitoring needed to maintain healthy, cost-efficient data pipelines. By implementing comprehensive alerts across Snowflake and BigQuery for cost anomalies, performance degradation, and resource waste, teams can catch issues within seconds rather than hours or days.
The platform's multi-channel notification system ensures alerts reach the right people at the right time, while built-in suggested actions help teams resolve issues quickly. Start with cost anomaly alerts to protect your budget, expand to performance alerts for user-facing queries, and build a comprehensive monitoring strategy that scales with your data operations. With Paradime Radar, your team can shift from reactive incident response to proactive data operations management.


