In the world of modern analytics engineering, monitoring your dbt™ schedules isn't just about knowing when jobs run—it's about understanding execution patterns, identifying bottlenecks before they impact production, and continuously optimizing your data pipelines for peak performance. Paradime's Radar Schedules Dashboard transforms schedule monitoring from reactive troubleshooting into proactive performance management.
Introduction to Paradime
Paradime is an AI-powered workspace for analytics teams that consolidates the entire analytics workflow into one platform, eliminating tool sprawl. With features like Code IDE for friction-free development, DinoAI as your intelligent co-pilot, and Paradime Bolt for production-grade orchestration, teams achieve 50-83% productivity gains and 25-50% faster development cycles. Paradime's Radar monitoring suite provides real-time insights with automated alerts, column-level lineage from source to BI, and comprehensive dbt™ monitoring capabilities that help teams maintain 100% uptime while reducing warehouse spending by 20%+.
What is the Paradime Radar Schedules Dashboard?
Overview of Radar's dbt™ Monitoring Suite
The Schedules Dashboard is one of four integrated monitoring dashboards within Paradime Radar's dbt™ Monitoring suite, each designed to provide comprehensive insights into different aspects of your analytics operations. While the Models Dashboard analyzes data model performance and materialization strategies, the Sources Dashboard monitors data freshness, and the Tests Dashboard tracks data quality outcomes, the Schedules Dashboard focuses specifically on execution efficiency and reliability.
This integrated approach ensures you can trace performance issues from schedule-level execution down to individual model performance, creating a complete observability story. Radar extends beyond dbt™ monitoring to include Cost Management, Team Efficiency Tracking, Real-time Alerting, Looker Monitoring, and a Data Catalog—making it a comprehensive command center for your entire analytics infrastructure.
Key Features of the Schedules Dashboard
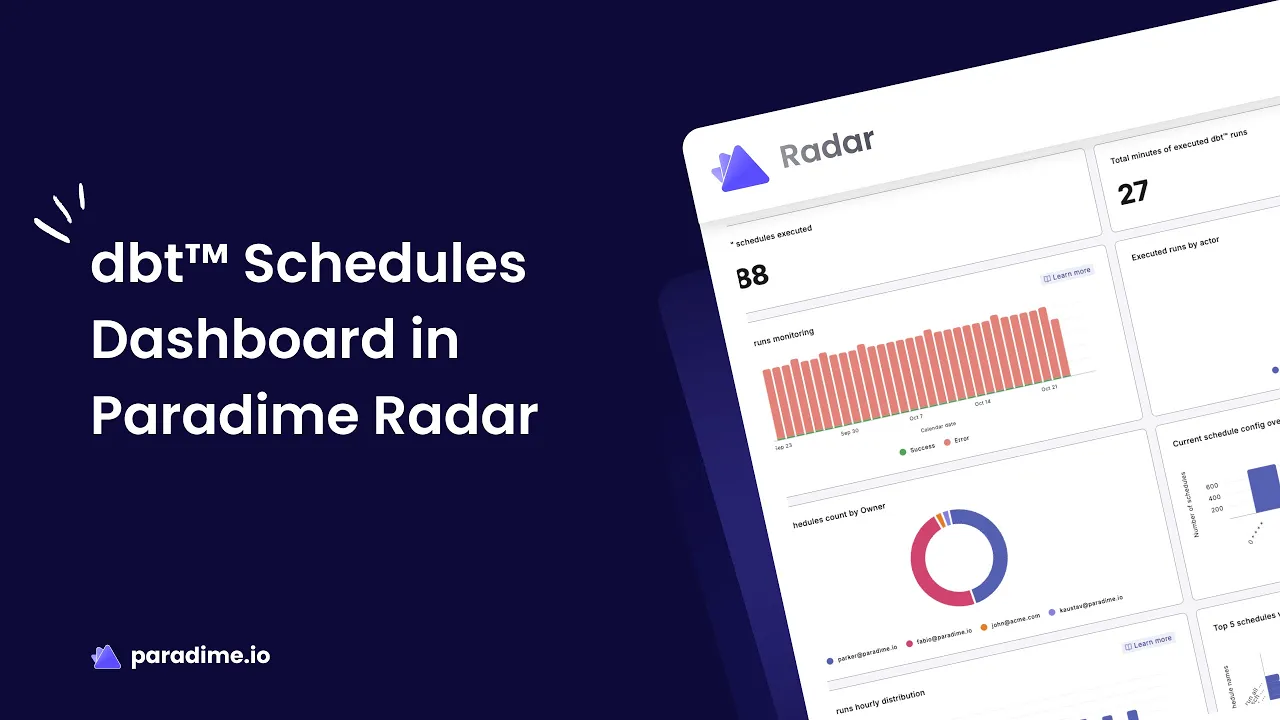
The Schedules Dashboard employs a two-section architecture designed to accommodate both high-level oversight and granular investigation. The Overview section provides executive-level visibility into schedule health across your entire dbt™ estate, while the Detailed section enables deep-dive analysis into individual schedule performance.
Powerful filtering capabilities sit at the top of the dashboard, allowing you to select specific schedules or define custom date ranges for targeted analysis. This combination of breadth and depth makes the dashboard equally valuable for daily health checks and detailed performance investigations.
Understanding the Overview Section
Execution Efficiency and Reliability Metrics
The Overview section's execution efficiency metrics give you immediate visibility into schedule reliability. Daily success and error rate tracking helps you quickly identify problematic days and investigate patterns—whether errors spike on certain days of the week, during peak processing hours, or following deployment windows.
The dashboard highlights schedules with the highest error counts, allowing you to prioritize remediation efforts where they'll have the greatest impact. By monitoring execution time patterns alongside error rates, you can distinguish between genuine failures and schedules that are simply timing out due to performance degradation.
Resource Allocation and Performance Analysis
Understanding how your schedules run—whether through automated Scheduler triggers, Bolt Run completions, or manual executions—provides critical insights into team workflows and resource utilization. A high proportion of manual runs might indicate scheduling configuration issues, while an imbalance between automated and manual executions could reveal opportunities for better automation.
The dashboard identifies schedules with unusually long runtimes, helping you spot performance degradation before it impacts downstream processes. Peak hour analysis reveals when your data warehouse experiences the heaviest load, enabling you to stagger schedule execution, avoid resource contention, and potentially reduce warehouse costs through better load distribution.
Schedule Configuration and Ownership
The configuration distribution view shows how your schedules are organized across your team, revealing consolidation opportunities. Multiple similar cron schedules might be candidates for combining into a single, more efficient workflow. The ownership distribution ensures clear accountability—knowing which team members own which schedules improves incident response and facilitates knowledge sharing.
Overall dbt™ Usage Tracking
High-level KPIs like total executed schedules and aggregate execution time provide essential metrics for capacity planning and team reporting. These numbers help you demonstrate infrastructure value, justify resource allocation, and track improvements over time as you implement optimizations.
Diving into the Detailed Section
Schedule Reliability and Performance Deep Dive
The Detailed section enables focused analysis of individual schedule behavior. Overall success rate tracking per schedule reveals chronic reliability issues, while run count monitoring over time helps you understand execution frequency and identify unexpected schedule triggering.
Duration analysis for each run exposes performance trends—is a schedule gradually slowing down, indicating data growth or query degradation? Error pattern identification helps you determine whether failures are random anomalies or systematic issues requiring architectural changes. Detecting unusually long run times early allows you to investigate before performance impacts SLAs or downstream dependencies.
Model Performance and Resource Utilization
Not all models within a schedule consume equal resources. The dashboard identifies models with the highest average run times, helping you target optimization efforts effectively. Execution time distribution across dbt™ commands—whether building, testing, or snapshotting—reveals where your schedules spend most of their time.
Understanding this resource utilization balance enables model-level performance optimization. Perhaps a particular model has become a bottleneck as data volumes grew, or specific test suites now dominate execution time. These insights drive data-driven decisions about refactoring, materialization strategy changes, or incremental model implementations.
Detailed Execution Analysis
When troubleshooting becomes necessary, granular run specifics prove invaluable. Each run's execution time, final status, and runtime breakdown illuminate exactly what happened. Individual model performance visibility within schedules helps you identify which specific transformation is causing failures or slowdowns.
This level of detail accelerates root cause analysis during incidents. Instead of digging through logs, you can quickly pinpoint problematic models or steps and begin remediation immediately.
Historical Performance Trends
Long-term trend analysis separates normal variation from genuine performance degradation. The dashboard's historical view helps you identify recurring patterns—perhaps certain schedules consistently slow down at month-end when processing volumes spike, or specific models degrade gradually as dimensions grow.
These data-driven insights enable proactive optimization rather than reactive firefighting. You can assess the impact of optimization efforts by comparing performance before and after changes, validating that your interventions achieved their intended improvements.
How to Use the Schedules Dashboard Effectively
Setting Up Your Monitoring Workflow
Before accessing the Schedules Dashboard, ensure you've completed dbt™ Monitoring setup through Radar's Getting Started guide. Once configured, navigate to the Radar section within Paradime and select the Schedules Dashboard.
Start by using the date range selector to establish your analysis window—whether reviewing yesterday's performance, analyzing last week's trends, or investigating month-over-month changes. The schedule filter lets you focus on critical production pipelines during incidents or zoom out to monitor all schedules during routine health checks.
Best Practices for Schedule Monitoring
Establish baseline performance metrics for your schedules during normal operations. Understanding typical execution times, expected success rates, and standard resource consumption creates the foundation for detecting anomalies. Set up proactive monitoring routines—daily reviews of error rates and execution times catch issues before they escalate.
Identify early warning signs of degradation by tracking subtle performance changes. A schedule consistently adding a few minutes to its runtime might not trigger immediate concerns, but left unchecked, could eventually cause cascade failures in downstream processes.
Troubleshooting Common Issues
When investigating high error rates, start by examining whether failures cluster around specific time periods or affect particular models. Schedule runtime spikes often correlate with unexpected data volume changes or warehouse resource contention—the dashboard helps you determine whether the issue is isolated or systemic.
Resource bottlenecks frequently manifest as gradually increasing execution times. By comparing current performance against historical baselines, you can quantify degradation and prioritize resolution based on business impact.
Optimizing dbt™ Schedule Performance with Radar
Identifying Optimization Opportunities
Dashboard insights help you prioritize improvements by revealing which schedules have the greatest performance gaps or reliability issues. Analyzing execution patterns uncovers efficiency gains—perhaps certain schedules could run less frequently without impacting freshness, or specific transformations could benefit from incremental processing.
Balance schedule frequency with resource usage by understanding the true execution cost of each pipeline. Running schedules more frequently than business requirements dictate wastes warehouse resources and increases costs unnecessarily.
Improving Schedule Reliability
Address recurring error patterns by identifying their root causes—are failures due to source data quality issues, transformation logic errors, or resource timeouts? Optimize schedule timing to avoid conflicts by leveraging peak hour analysis. Staggering schedule execution prevents resource contention and improves overall pipeline reliability.
Implement better resource allocation by understanding which schedules require more warehouse compute and adjusting cluster sizes or execution windows accordingly.
Leveraging Alerts and Notifications
Paradime integrates with multiple alerting platforms, enabling proactive monitoring strategies. Set up automated alerts for schedule failures through PagerDuty for on-call escalation, Datadog for comprehensive observability, or Slack and Microsoft Teams for team notifications. You can also integrate with Rootly, Incident.io, New Relic, or use webhooks for custom integrations.
Creating comprehensive notification strategies ensures the right people receive alerts at the right time, reducing MTTR and preventing minor issues from becoming major incidents.
Advanced Features and Integrations
Integration with Paradime Bolt
Paradime Bolt provides production-grade orchestration with state-aware scheduling capabilities. Bolt schedules appear seamlessly in the Radar dashboard, providing unified visibility across all execution types—whether scheduler-triggered, manually initiated, or CI/CD-driven.
State-aware orchestration benefits include running only what's necessary based on data changes, dramatically reducing unnecessary compute and warehouse costs. CI/CD integration insights show how your development workflow impacts production, with Turbo CI enabling you to test changes before merging through automated Bolt schedule execution in temporary schemas.
Cost Management Connection
While the Schedules Dashboard focuses on execution performance, correlating schedule behavior with warehouse costs provides powerful optimization insights. Identify cost-intensive schedules by comparing execution frequency and duration against warehouse billing metrics. Optimize for both performance and cost efficiency by understanding which schedules drive warehouse spending and whether their business value justifies the expense.
Column-Level Lineage and Impact Analysis
Paradime's column-level lineage capabilities connect directly to your BI tools—Tableau, Looker, and ThoughtSpot—providing comprehensive impact analysis. Before making schedule or model changes, understand downstream impacts through automated lineage diff analysis in pull requests.
This prevents breaking changes before they reach production by showing exactly which BI dashboards, reports, or downstream dbt™ projects would be affected by your modifications. The integration between Radar monitoring and column-level lineage creates a complete observability ecosystem from source data through final BI consumption.
Conclusion
The Paradime Radar Schedules Dashboard transforms dbt™ schedule monitoring from a reactive troubleshooting tool into a strategic asset for analytics engineering excellence. By providing comprehensive visibility into execution efficiency, resource utilization, and performance trends, the dashboard enables teams to maintain reliability while continuously optimizing pipeline performance.
The real power emerges from integrating schedule monitoring with Paradime's broader ecosystem—Bolt orchestration, column-level lineage, automated alerting, and cost management. This holistic approach ensures your analytics infrastructure not only runs reliably but operates at peak efficiency, delivering maximum value from your data investments.
Ready to master your dbt™ schedule performance? Start by establishing baseline metrics for your critical pipelines, set up proactive alerting for anomalies, and schedule regular reviews of the Overview section to catch degradation early. The insights are waiting in your Radar dashboard—all you need to do is look.


