Introduction to Paradime
Paradime is an AI-powered workspace that consolidates your entire analytics workflow into one unified platform. Built as "Cursor for Data," Paradime eliminates tool chaos and fragmented toolchains where analytics teams traditionally jump between VSCode, dbt Cloud™, Airflow, Monte Carlo, and Looker. With features like DinoAI co-pilot, Paradime Bolt orchestration, and Paradime Radar monitoring, teams achieve 50-83% productivity gains and 25-50% faster development cycles. Companies like Tide, Customer.io, and Emma trust Paradime to deliver production-grade data pipelines with 100% uptime.
What is Paradime Bolt?
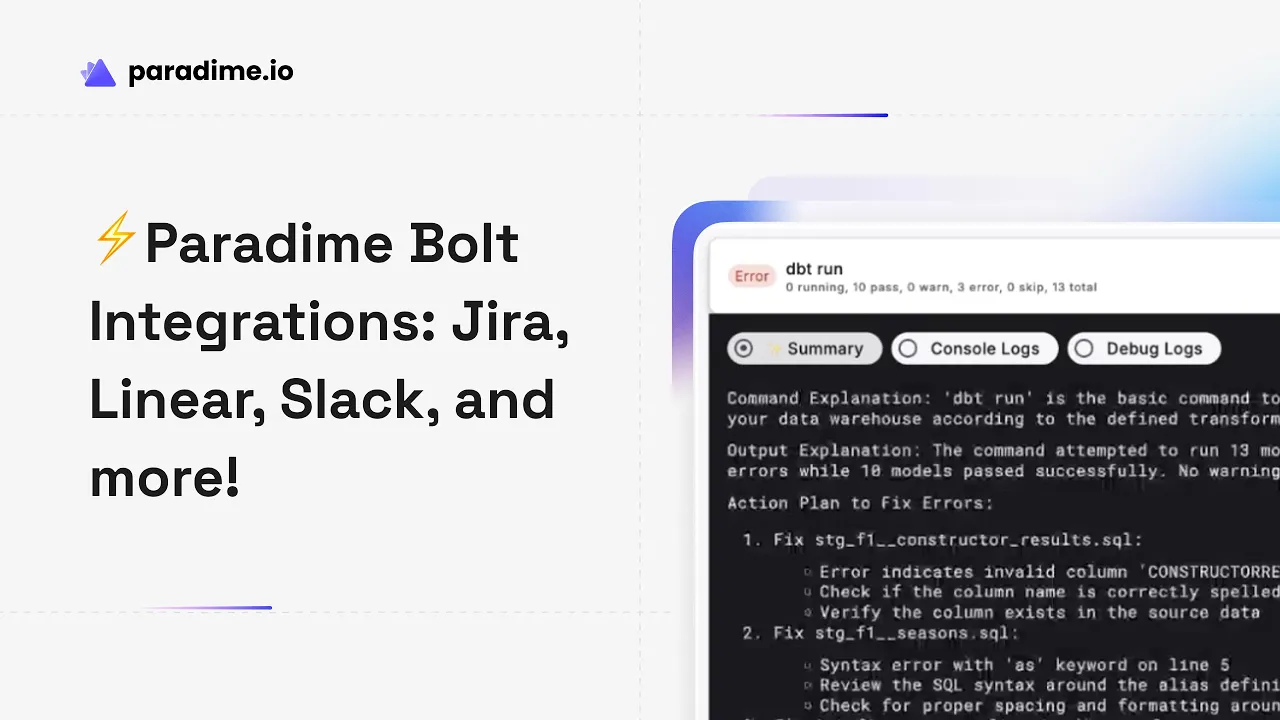
Paradime Bolt transforms dbt™ models into production-grade orchestration systems through declarative scheduling and state-aware orchestration. Instead of manually managing pipeline execution, Bolt provides a robust CI/CD framework with automated test runs and intelligent scheduling that enables teams to run 400+ models hourly while maintaining 100% uptime.
The orchestrator delivers comprehensive pipeline management capabilities including global timezone support, smart scheduling with dependency awareness, and sophisticated notification layers. This combination allows data teams to move from reactive fire-drills to proactive pipeline management where failures are tracked, documented, and resolved systematically.
The Challenge: Pipeline Failures as Fire-Drills
Traditional data pipeline failure management creates chaos for analytics teams. When a pipeline breaks at 2 AM, most teams discover it hours later through confused Slack messages from stakeholders asking why dashboards show stale data. The ensuing scramble involves digging through orchestrator logs, trying to remember what changed recently, and manually notifying everyone affected.
This reactive approach carries significant costs. Without proper documentation, teams repeatedly solve the same issues because institutional knowledge lives in individuals' heads rather than searchable systems. Accountability becomes fuzzy when there's no clear record of who's investigating what. Meanwhile, stakeholder trust erodes as business users can't rely on data freshness, and data teams spend more time explaining failures than preventing them.
The fundamental problem isn't just the technical failure—it's the unstructured response that amplifies the impact.
Paradime Bolt Integration Ecosystem
Bolt addresses pipeline failure chaos through a comprehensive integration ecosystem that automatically transforms failures into trackable, documented incidents. With 50+ integrations spanning ticketing systems, incident management platforms, communication tools, and downstream applications, Bolt ensures every pipeline failure triggers appropriate responses across your entire data stack.
Ticketing System Integrations
Automatic Jira Integration
Bolt's Jira integration automatically creates tickets the moment a pipeline fails. Each ticket includes complete context: schedule name and workspace, run ID with a direct link to Paradime logs, execution timestamps, commands that were executed, and branch information.
Setup takes minutes through a webhook template. Data teams provide their Jira base URL, generate an API token from Atlassian's security settings, and configure the integration in Bolt's Templates section. The webhook only triggers on failed runs, preventing ticket spam while ensuring no failure goes undocumented.
Linear Integration for Modern Teams
For teams using Linear's modern issue tracking, Bolt provides identical automatic ticket creation capabilities. When dbt pipeline runs fail, Linear issues are created with full run context including schedule details, run IDs with links back to Paradime, execution timing, commands, and branch information.
The integration requires only a Linear team name and Personal API Key from Linear's security settings. Like Jira, the webhook triggers exclusively on failures, giving agile data teams seamless incident tracking integrated with their sprint planning and development workflows.
Azure DevOps Integration
Enterprise organizations on the Microsoft stack can leverage Bolt's Azure DevOps integration for ticket creation. This ensures data pipeline incidents flow into the same work item tracking system used by broader engineering teams, enabling unified incident management across data and application development.
Incident Management Integrations
PagerDuty Integration
For critical data pipelines requiring 24/7 monitoring, Bolt's PagerDuty integration provides real-time alerting with escalation policies. When a revenue-impacting pipeline fails at 1:52 AM, PagerDuty receives the incident through Bolt's Events API integration within seconds.
The on-call engineer's phone rings with a high-urgency alert. The PagerDuty incident includes a title showing the schedule and workspace, a description with a direct link to Paradime run logs, run ID, timestamps, commands executed, branch information, and even an AI-generated summary of what broke.
Configuration involves generating a PagerDuty integration key, connecting it in Paradime's integration settings, and adding triggers to specific Bolt schedules. Teams customize urgency levels (High for immediate wake-up calls, Low for next-morning review), priority tiers (P1 for revenue pipelines down through P5 for minor issues), impacted services, and which escalation policy handles the alert.
The integration transforms critical pipeline failures from "discovered when stakeholders complain" to "on-call engineer notified and investigating within minutes."
New Relic and Datadog Integration
For teams with comprehensive observability platforms, Bolt creates events in New Relic and Datadog when pipeline runs fail. This connects data pipeline health with application performance monitoring, infrastructure metrics, and broader system observability—enabling data teams to correlate pipeline failures with infrastructure issues, resource constraints, or broader system problems.
Communication Platform Integrations
Slack Notifications
Bolt's Slack integration delivers instant pipeline failure notifications directly into team channels. Unlike email alerts that get buried, Slack notifications provide immediate visibility with actionable context—schedule name, failure summary, and links to investigate.
Teams configure notifications at the schedule level, choosing between success alerts (confirming critical pipelines completed), failure notifications (triggering immediate investigation), and SLA alerts (warning when runtimes exceed expected thresholds). This granular control prevents alert fatigue while ensuring critical failures surface immediately.
Microsoft Teams Integration
For enterprise teams standardized on Microsoft 365, Bolt provides equivalent notification capabilities through Teams. Pipeline incidents and status updates flow into Teams channels, keeping distributed teams synchronized on data pipeline health without adding another communication tool.
Reverse ETL Integrations
Hightouch Integration
Bolt integrates with Hightouch to trigger syncs the moment Paradime schedules complete successfully. This ensures business tools like Salesforce, HubSpot, and advertising platforms receive fresh data immediately after warehouse transformations finish—automating the entire flow from raw data ingestion through transformation to operational system syncing.
Census Integration
Similar to Hightouch, Bolt's Census integration triggers operational analytics syncs based on pipeline completion. Teams configure Census sync URLs in Bolt templates, creating automated workflows where successful pipeline runs immediately refresh downstream business applications with the latest customer data, product analytics, or operational metrics.
Analytics Tool Integrations
Hex Project Refresh
For teams using Hex for notebooks and analysis, Bolt can automatically trigger project refreshes when upstream pipelines complete. Analysts opening notebooks see fresh data without manually re-running queries, eliminating the common workflow gap where analysis uses stale data because nobody remembered to refresh after the nightly pipeline.
BI Tool Integrations
Bolt extends this orchestration to BI platforms including Looker, Tableau, Power BI, and others. Dashboard refreshes trigger automatically after relevant pipelines complete, ensuring business users always see current data while eliminating manual refresh coordination between data engineers and BI developers.
How Bolt Integrations Work
Setting up Bolt integrations follows a consistent pattern across tools. Teams start in Bolt's Templates section, which provides pre-built integration templates organized by category—ticketing, reverse ETL, observability, and notifications. Each template requires tool-specific credentials: API tokens for Jira and Linear, integration keys for PagerDuty, sync URLs for Census, team names for Slack and Teams.
After configuring credentials, teams add integrations as triggers to specific schedules. This granular control means critical production pipelines might trigger PagerDuty high-urgency alerts and create Jira tickets, while development pipelines simply send Slack notifications to the engineering channel.
Authentication and security follow industry standards. API tokens are stored encrypted in Paradime's secure credential management. OAuth connections for platforms supporting it provide token rotation and granular permission scoping. All data transmission occurs over encrypted channels, and integrations access only the minimum permissions required—creating tickets, sending notifications, or triggering syncs without broader system access.
The configuration philosophy emphasizes speed-to-value: most integrations require 2-5 minutes to configure and start delivering value immediately on the next pipeline run.
Use Cases and Workflows
Automated Incident Management Workflow
Consider a typical incident workflow with Bolt integrations: A critical customer analytics pipeline fails at 3:27 AM due to an upstream schema change. Within 30 seconds, Bolt triggers the configured incident response:
A high-urgency PagerDuty alert wakes the on-call analytics engineer
A Jira ticket is automatically created with full run context and logs link
A Slack message appears in #data-incidents channel with failure summary
The engineer acknowledges the PagerDuty incident from their phone
They click the Paradime link, review logs, identify the schema issue
The fix is deployed and the pipeline re-run succeeds at 4:12 AM
The Jira ticket is updated with resolution notes
Slack receives a success notification confirming the pipeline is healthy
Compare this to the traditional workflow: The failure is discovered at 9:30 AM when marketing asks why yesterday's campaign metrics look wrong. Someone manually investigates, posts in Slack, fixes the issue by 11 AM, but there's no permanent record beyond scattered Slack messages. The incident repeats three weeks later because nobody documented the root cause.
Enterprise-Grade Pipeline Management
For organizations managing hundreds of models across multiple teams, Bolt integrations create comprehensive compliance and audit capabilities. Every failure generates a ticket with complete context. Resolution time is tracked automatically. Patterns emerge from ticket metadata—showing which models fail most frequently, which teams have longest resolution times, and which upstream dependencies create cascading failures.
This structured incident data transforms reactive firefighting into proactive reliability engineering.
Cross-Team Collaboration
Bolt integrations bridge the gap between data engineers maintaining pipelines, analytics engineers building models, and business stakeholders consuming data. When a pipeline fails, engineers receive PagerDuty alerts while business users see Slack updates explaining the impact and expected resolution time. The automatically-created ticket becomes a central coordination point where technical investigation notes, business impact assessment, and resolution verification all live together—providing clear accountability and complete documentation.
Best Practices for Bolt Integrations
Designing Effective Notification Strategies
The key to avoiding alert fatigue while maintaining comprehensive monitoring is matching notification channels to pipeline criticality and audience. Critical production pipelines serving executive dashboards should trigger PagerDuty high-urgency alerts, Jira tickets, and Slack notifications to both engineering and stakeholder channels. Development pipelines might only send Slack messages to the engineering team channel.
Similarly, success notifications make sense for pipelines where "no news is bad news"—critical overnight ETL jobs where silence suggests the schedule didn't run. But development pipelines don't need success celebrations cluttering channels.
Ticket Management Best Practices
Automatically-generated tickets need sufficient context for someone unfamiliar with the pipeline to understand what broke and why it matters. Bolt provides the technical context—schedule name, run ID, logs link, commands executed. Teams should supplement this with custom fields mapping pipelines to business impact, data owners, and escalation contacts.
Priority and severity mappings should reflect actual business impact. Revenue-affecting pipelines failing warrant P1/critical severity. Test environment failures in non-blocking development schedules don't need urgent classification even though they technically "failed."
Building Scalable Integration Architecture
As data teams grow, integration strategy should evolve from individual schedule configuration to standardized patterns. Define integration templates for different pipeline tiers—production, staging, development—and apply them consistently. This creates predictable incident response patterns, reduces configuration overhead, and ensures no critical pipeline lacks appropriate monitoring.
Consider integration ownership as well. Teams managing 50+ pipelines shouldn't require every data engineer to configure PagerDuty and Jira individually. Centralized configuration through Bolt templates enables platform teams to manage integration patterns while analytics engineers focus on model development.
Benefits of Integrated Pipeline Management
Faster Failure Resolution
Structured incident management through Bolt integrations dramatically reduces mean-time-to-resolution (MTTR). Instead of failures hiding until stakeholders complain, teams receive immediate notifications with complete context. The difference between "discovered at 9 AM when someone asks about stale data" and "on-call engineer alerted at 2:03 AM with logs link and AI failure summary" often means the difference between 30-minute resolution and 6-hour business impact.
Better Documentation and Accountability
Every automatically-created ticket becomes permanent documentation of what broke, how it was fixed, and how long resolution took. Over time, these tickets create a searchable knowledge base. New team members troubleshooting similar failures find past resolutions. Post-mortems have complete timeline data. Pattern analysis reveals systemic issues requiring architectural changes rather than repeated firefighting.
Improved Team Productivity
Manual incident response—checking orchestrator logs, copy-pasting error messages into Slack, creating tickets, notifying stakeholders—consumes hours weekly for data teams managing production pipelines. Bolt integrations eliminate this toil through automation, freeing data engineers to focus on developing new models, optimizing performance, and implementing better data quality tests.
Enhanced Stakeholder Communication
Business users trust data more when failures are communicated proactively with clear resolution timelines. A Slack message stating "customer analytics pipeline failed at 3:27 AM, on-call engineer is investigating, estimated resolution by 6 AM" builds more confidence than discovering stale data at 10 AM with no explanation. Integrated pipeline management transforms data teams from "mysterious backend infrastructure" to reliable partners with transparent operations.
Getting Started with Bolt Integrations
Accessing the Integration Marketplace
Paradime's integration marketplace is accessible directly within Bolt through the Templates section in the left navigation panel. Templates are organized by category—ticketing, incident management, reverse ETL, observability—making it easy to find the right integration for your stack.
Quick Start Guide
For teams new to Bolt integrations, start with these three essential connections:
Slack notifications for immediate visibility into pipeline health across the team
Jira or Linear ticketing for structured incident tracking and resolution documentation
PagerDuty or similar incident management for critical production pipelines requiring 24/7 monitoring
This combination provides immediate awareness, proper documentation, and appropriate escalation for urgent issues—covering the core incident management workflow.
Documentation and Support Resources
Paradime provides comprehensive documentation for each integration at docs.paradime.io, including setup guides, configuration options, and troubleshooting tips. The Paradime community and support team offer assistance with integration configuration, and most integrations include template configurations that work out-of-the-box with minimal customization needed.
Conclusion
The Future of Data Pipeline Management
Data pipeline failures are inevitable—schema changes happen, external APIs become temporarily unavailable, and resource constraints cause timeouts. What separates high-functioning data teams from those stuck in perpetual firefighting mode isn't the absence of failures, but how failures are detected, managed, and resolved.
Paradime Bolt's integration ecosystem transforms pipeline failures from chaotic fire-drills into structured, trackable incidents with clear ownership, comprehensive documentation, and measurable resolution metrics. By automatically connecting pipeline orchestration with ticketing systems, incident management platforms, communication tools, and downstream applications, Bolt creates a complete data pipeline management system where failures trigger appropriate responses across your entire stack.
The result: faster resolution times, better documentation, improved accountability, and data teams that spend less time firefighting and more time delivering value.
Next Steps
Start exploring Bolt integrations today with a free Paradime trial. Connect your first integration—whether Slack for team visibility, Jira for incident tracking, or PagerDuty for critical alerting—and experience how integrated pipeline management transforms data operations from reactive chaos to proactive reliability.


