Introduction
Paradime is an AI-powered workspace for analytics teams that consolidates your entire analytics workflow into one platform. By eliminating tool chaos, Paradime enables teams to ship 10x faster with proven productivity gains of 50-83% compared to fragmented toolchains. With features like DinoAI for intelligent code generation, Bolt for production-grade orchestration, and Radar for real-time monitoring, Paradime helps high-velocity data teams reduce warehouse spending by 20%+ while accelerating development cycles by 25-50%.
Understanding Data Source Freshness
What is Data Source Freshness?
Data source freshness measures how recently data in your source tables has been updated, providing critical insights into the health and reliability of your data pipelines. Fresh data ensures accurate, timely decision-making, while stale data can lead to delayed decisions, missed opportunities, and mistrust in analytical outputs.
Why Data Source Freshness Matters
Fresh data is the foundation of reliable analytics. When your source data is stale, the impact ripples throughout your entire organization:
Ensures data pipelines meet defined SLAs - Keep your data delivery promises to stakeholders
Enables proactive identification of upstream data issues - Catch problems before they cascade downstream
Maintains trust in analytical outputs and BI dashboards - Keep executives confident in their reports
Prevents downstream impacts on business decisions - Avoid costly mistakes from outdated information
Identifies patterns in data delivery and pipeline performance - Optimize your data infrastructure over time
Common Data Freshness Challenges
Analytics teams face persistent challenges in maintaining fresh data: delayed or failed upstream ETL processes, source system outages, schema changes breaking data ingestion, network connectivity problems, and insufficient monitoring capabilities. Without proper visibility, these issues can go undetected until they impact critical business decisions.
Introducing Paradime Radar Sources Dashboard
Overview of Radar's Monitoring Capabilities
Paradime Radar provides real-time intelligence for analytics work with column-level lineage from source to BI, automated alerts through PagerDuty, DataDog, and Slack, and impact analysis showing which dashboards will break before merge. The Sources Dashboard specifically focuses on comprehensive insights into data source freshness and health across your entire data pipeline.
Prerequisites for Setup
Before using the Sources Dashboard, complete the dbt™ Monitoring setup in Radar's Get Started guide. This ensures proper integration with your dbt™ projects and enables automatic tracking of source freshness metrics.
Overview Section: High-Level Metrics
Source Freshness Overview
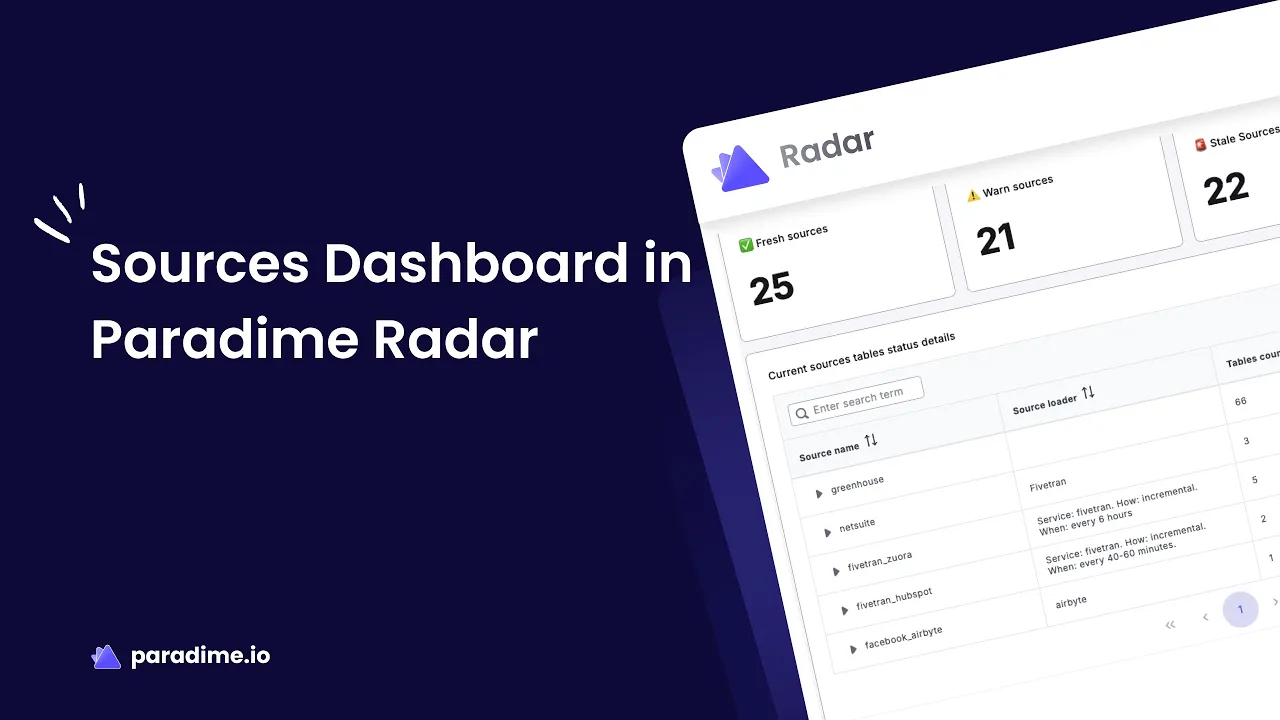
The Source Freshness Overview provides an at-a-glance assessment of your data sources' freshness status. Monitor the number of sources in each category—Fresh, Warn, Stale, and Errored—to quickly identify potential issues and track metrics over time. This visual representation helps you understand your data health in seconds, not hours.
Current Source Tables Status Details
Access detailed information about the current freshness status of all source tables in your data warehouse. The interface includes expandable dropdowns to review individual sources, search functionality for specific sources or tables, detailed status indicators for each table, and quick navigation to tables needing immediate attention.
Source Health Monitoring
Monitor the overall health of your data sources over time to observe health trends, identify patterns or recurring issues, and prioritize maintenance and optimization efforts. This long-term view helps analytics engineers understand seasonal patterns, track improvements from optimization work, and justify infrastructure investments.
Detailed Section: Deep-Dive Analysis
Individual Source Freshness Status
Get a detailed view of freshness status for specific sources to assess the health of critical data inputs. Monitor mission-critical sources separately, compare freshness across related sources, track improvements after remediation efforts, and set up source-specific monitoring protocols.
Data Source Freshness Details
Analyze comprehensive freshness information for each table within a source, including freshness criteria and thresholds (warn_after, error_after), current status, last loaded timestamps, tables approaching warning or error thresholds, and historical freshness patterns.
This granular view enables proactive maintenance by identifying tables that consistently approach thresholds, allowing teams to adjust upstream processes or SLA definitions before issues impact downstream consumers.
Freshness Trends Analysis
Understand how source freshness evolves over time with trend visualizations that show passed vs. errored sources, recurring patterns in freshness issues, impact of optimization efforts, seasonal variations in data delivery, and correlation between different source failures.
Configuring Source Freshness in dbt
Declaring Source Freshness
Define freshness expectations in your dbt™ source YAML files using warn_after and error_after thresholds. Here's a practical example:
Understanding Freshness Thresholds
The configuration is straightforward but powerful. The warn_after threshold triggers a warning when data exceeds this age, giving you an early heads-up. The error_after threshold triggers an error when data becomes critically stale, demanding immediate attention. The loaded_at_field specifies which timestamp column determines data recency. You can configure hierarchically from source level to individual tables, and set freshness: null to exclude specific tables from checks.
Running Freshness Checks
Execute dbt source freshness to check data freshness across all configured sources. Paradime Bolt can automate this process through scheduled runs, ensuring continuous monitoring without manual intervention.
Best Practices for Data Freshness Monitoring
Defining Appropriate SLAs
Establish data freshness SLAs based on business requirements and decision-making needs. Consider the criticality of the data source, downstream dependencies and consumers, typical refresh schedules of source systems, acceptable latency for business decisions, and resource constraints. Not all data needs to be real-time—align your thresholds with actual business needs.
Proactive Issue Detection
Use Paradime Radar to identify tables approaching warning thresholds before they impact downstream models or dashboards. Set up automated alerts to notify teams immediately when freshness issues occur. This shift from reactive to proactive monitoring transforms how analytics teams operate.
Establishing Monitoring Workflows
Create clear workflows for responding to freshness alerts: immediate notification through Slack, PagerDuty, or DataDog, investigation using Radar's detailed freshness information, root cause analysis using lineage and dependency views, communication with upstream data providers, and documentation of recurring issues and resolutions.
Leveraging Trends for Optimization
Analyze freshness trends to identify optimization opportunities. Sources with consistently delayed data may need schedule adjustments. Recurring patterns might indicate batch processing inefficiencies. Improved freshness trends validate optimization efforts, while historical data supports capacity planning and resource allocation.
Integrating Freshness Monitoring with Your Workflow
Automated Alerting and Notifications
Configure Paradime Radar to send automated alerts when source freshness degrades. Integration with tools like Slack, PagerDuty, and DataDog ensures the right teams receive notifications immediately, not when it's too late.
Impact Analysis Before Deployment
Use Radar's impact analysis capabilities to understand which Looker or Tableau dashboards depend on specific sources. This prevents deploying changes that could break downstream analytics due to freshness issues.
Coordinating with Upstream Teams
Share freshness metrics with data engineering and ETL teams responsible for upstream data delivery. Radar's dashboards provide objective data to support conversations about SLA adherence and pipeline improvements, turning subjective complaints into data-driven discussions.
Troubleshooting Common Freshness Issues
Identifying Root Causes
When freshness alerts trigger, use Paradime Radar's detailed views to determine which specific tables are stale, check if the issue affects multiple related sources, review historical patterns to identify anomalies, and examine lineage to understand upstream dependencies.
Upstream Data Pipeline Failures
Common causes include ETL job failures, API rate limiting, source system downtime, or credential expiration. Use Radar's monitoring to distinguish between one-time incidents and systemic issues that require architectural changes.
Schema Changes and Breaking Updates
Schema changes in source systems can break data ingestion processes. Radar's impact analysis helps identify affected downstream models and dashboards, enabling coordinated updates across your entire analytics stack.
Conclusion
Key Takeaways
Data source freshness is critical for reliable analytics, and Paradime Radar provides comprehensive, automated monitoring that transforms how teams manage data quality. Proactive monitoring prevents downstream impacts, while trends and patterns enable continuous optimization. Integration with alerting tools ensures rapid response when issues arise.
Next Steps
Complete Radar setup for your dbt™ projects, define source freshness thresholds based on business needs, configure automated alerts for critical sources, establish monitoring workflows and escalation procedures, and regularly review trends to identify optimization opportunities.
Additional Resources
Explore Paradime Radar Documentation, the dbt Source Freshness Guide, Data Observability Best Practices, and the Analytics Engineering Handbook to deepen your understanding and maximize the value of your data freshness monitoring implementation.


