Introduction
In today's data-driven landscape, Looker has become an essential business intelligence tool—but without proper monitoring, costs can spiral out of control. Unmonitored dashboards, expensive explores, and inefficient queries can lead to unexpected warehouse bills that devastate analytics budgets. Enter Paradime Radar's Looker monitoring suite: a comprehensive solution that gives teams real-time visibility into spending patterns, usage metrics, and optimization opportunities.
Paradime is an AI-powered workspace that consolidates the entire analytics workflow, eliminating tool sprawl by unifying development, orchestration, and monitoring. With proven results including 10x faster shipping, 50-83% productivity gains, and 20%+ reductions in warehouse spending, Paradime delivers production-grade capabilities through features like DinoAI co-pilot, Paradime Bolt orchestration, and comprehensive monitoring tools. Organizations like Tide, Customer.io, and Emma use Paradime to accelerate development cycles, achieve real-time visibility with column-level lineage, and optimize costs through intelligent query management and automated workflows.
This guide walks you through leveraging Paradime Radar to monitor, analyze, and optimize your Looker costs—helping you maintain high-performance analytics while dramatically reducing data warehouse expenses.
Understanding Looker Cost Challenges
Why Looker Costs Spiral Out of Control
Many organizations discover their Looker implementation consuming far more resources than anticipated. Several factors contribute to runaway spending:
Unmonitored query volumes create blind spots where expensive explores run continuously without oversight. Dashboard auto-refresh settings compound the problem by executing queries on schedules that don't align with actual business needs. Meanwhile, unused or rarely accessed dashboards continue consuming warehouse resources in the background.
Lack of visibility into daily spending patterns prevents teams from identifying cost optimization opportunities before they impact budgets. Inefficient data models with complex joins and unoptimized query structures further inflate costs, while deprecated content continues generating queries long after business value has diminished.
The Business Impact
The consequences of uncontrolled Looker spending extend beyond finance. Unexpected warehouse bills force budget reallocation and limit investment in strategic initiatives. Resources get channeled toward low-value analytics projects while high-impact work goes unfunded. Without proper monitoring tools, teams lack the insights needed to make data-driven optimization decisions, creating a cycle of waste that compounds over time.
Getting Started with Paradime Radar for Looker Monitoring
Prerequisites and Setup
Before diving into cost optimization, you'll need to configure Looker monitoring in Paradime Radar. The setup requires an active Paradime Radar Plan and Admin role in Paradime.
The process involves three key steps:
Create a dedicated Looker user specifically for Paradime's integration
Generate API 3 credentials to enable secure communication between platforms
Connect your Looker instance through Paradime's native integration
Once configured, verify your setup by navigating to the Radar dashboard and confirming data is populating correctly. For detailed setup instructions, consult the Paradime Radar Getting Started guide.
Navigating the Dashboard Interface
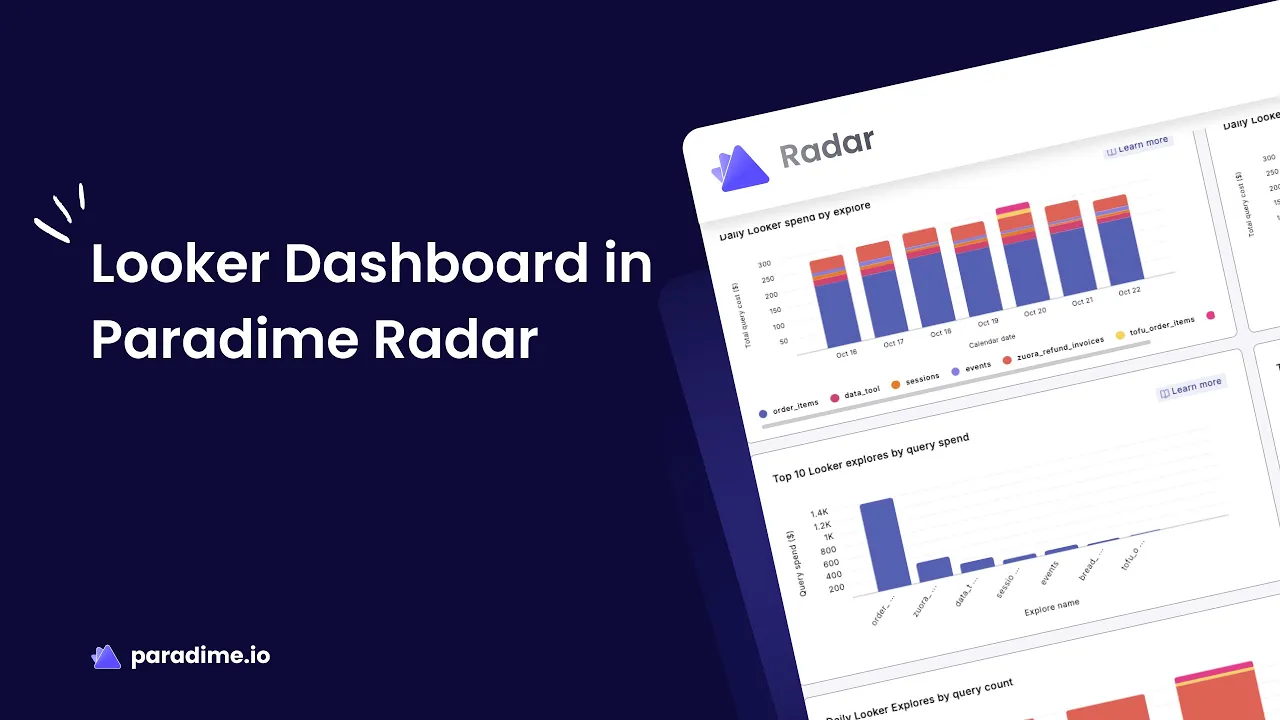
The Looker Monitoring Dashboard divides into two primary sections: Explores and Dashboards. The Explores section analyzes usage and costs at the explore and model level, while the Dashboards section provides insights into dashboard-specific spending and performance.
Both sections feature date range filters at the top, allowing you to focus analysis on specific time periods. This functionality enables you to compare spending patterns across weeks, identify monthly trends, or investigate unusual spikes during particular business cycles.
Monitoring Explores: Usage and Cost Analysis
Daily Spend Analysis
The Daily Spend Analysis view tracks spending patterns across all your explores and models, revealing which components drive the highest warehouse costs. This visualization helps identify unusual spending spikes that may indicate inefficient queries, data model issues, or unexpected usage patterns.
By comparing spend across different explores and models, you can quickly pinpoint optimization priorities. A sudden spike in an explore's daily cost might signal a new dashboard consuming excessive resources, a change in user behavior, or a modeling issue that's causing query inefficiency.
Identifying Top Spenders
The Top Spenders view ranks your explores and models by total query costs, providing an at-a-glance understanding of where money flows. This prioritization framework ensures optimization efforts focus on the highest-impact opportunities.
When investigating expensive explores, ask critical questions: Does the usage justify the cost? Could the model be restructured for efficiency? Are there redundant calculations or joins that could be eliminated? High-cost items that see minimal usage become prime candidates for deprecation or consolidation.
Usage Pattern Analysis
Understanding usage patterns is crucial for making informed optimization decisions. The usage visualization shows daily frequency across explores, distinguishing between heavily utilized resources and rarely accessed components.
Correlating usage with cost reveals important insights. High-usage, high-cost explores may warrant investment in optimization since improvements benefit many users. Conversely, high-cost explores with minimal usage should be evaluated for archiving—freeing up resources without impacting business operations.
Monitoring Dashboards: Performance and Efficiency
Dashboard Spend Tracking
Dashboard spend analysis provides daily cost tracking for individual dashboards, enabling teams to monitor trends and set appropriate budget allocations. Identifying patterns helps establish baselines and spot anomalies before they become serious budget issues.
This granular visibility empowers teams to set spending alerts and thresholds, creating proactive cost management rather than reactive damage control. When a dashboard's daily spend exceeds expected levels, teams can investigate immediately rather than discovering the issue at month's end.
Top Dashboard Spenders
Similar to explore analysis, ranking dashboards by total cost focuses optimization efforts where they'll deliver maximum impact. The view includes query complexity indicators and runtime metrics that help diagnose performance issues.
Expensive dashboards require evaluation: Is the dashboard business-critical? Does it deliver sufficient value to justify its cost? Could query logic be optimized or tiles consolidated? These questions guide strategic decisions about which dashboards merit optimization investment versus retirement.
Active Usage Metrics
The "Last accessed" column provides powerful insights into dashboard utilization. Dashboards that haven't been viewed in weeks or months represent pure waste—consuming resources without delivering value.
Runtime and query cost metrics reveal performance characteristics, while the "run on load" indicator shows which dashboards execute queries immediately upon opening. Dashboards set to run on load with high query costs and infrequent access become obvious candidates for optimization or archiving.
Cost Optimization Strategies
Streamlining Data Models
Efficient LookML models form the foundation of cost-effective Looker implementations. Start by optimizing join structures—building explores using many-to-one joins from most granular to highest level of detail. This approach reduces query complexity and improves performance.
Eliminate redundant fields and calculations that add processing overhead without business value. Implement aggregate awareness to create summary tables for common queries against large datasets, dramatically reducing scan volumes. Use persistent derived tables (PDTs) strategically for complex transformations, and configure incremental PDTs when your database dialect supports them to minimize rebuild overhead.
Leveraging Caching Strategies
Looker's caching mechanism is one of your most powerful cost-reduction tools. By default, Looker caches queries for one hour—but strategic caching configuration aligned with ETL schedules maximizes reuse while maintaining data freshness.
Use datagroups to define named caching policies that can be applied across models, explores, and PDTs using the persist_with parameter. This ensures Looker refreshes data in sync with your ETL processes, maximizing cache utilization without analyzing stale data. When multiple users or dashboards query the same data, cached results eliminate redundant warehouse queries entirely.
Query Performance Optimization
Several techniques dramatically improve query performance while reducing costs. In BigQuery environments, implement partitioning and clustering on commonly filtered fields to minimize data scanned. Create materialized views for frequently executed queries, pre-computing results rather than processing them on-demand.
Avoid joining views on concatenated primary keys defined in Looker—either join on base fields or recreate the view as a PDT. Use required filters, conditionally_filter, and sql_always_where parameters in LookML to prevent users from accidentally executing full table scans. The EXPLAIN functionality in Looker's SQL Runner tool helps benchmark queries and understand execution plans for targeted optimization.
Dashboard Optimization Techniques
Dashboard design significantly impacts costs. Limit dashboard tiles to 25 or fewer—larger dashboards create performance issues and consume excessive memory. Use auto-refresh strategically, ensuring refresh rates don't exceed ETL frequency. There's no value in refreshing dashboards every five minutes when underlying data updates hourly.
Apply pivots sparingly, as they consume significantly more memory than standard visualizations. Use frontend filters on dashboards and explores to limit default result sets, preventing users from inadvertently returning millions of rows. Consider linking dashboards with buttons rather than embedding them, which can reduce concurrent query loads.
Building a Cost-Conscious Analytics Culture
Training and Best Practices
Technology alone won't solve cost problems—sustainable optimization requires cultural change. Educate teams on query optimization fundamentals, helping developers understand how their modeling choices impact warehouse spending. Establish usage guidelines for efficient development, creating standards that become second nature.
Share cost-efficient dashboard design standards across the organization, celebrating examples of high-value, low-cost implementations. When best practices are visible and reinforced, they spread organically through teams.
Prioritizing High-Value Projects
Not all analytics projects deliver equal value. Implement ROI analysis frameworks that evaluate projects based on potential business impact relative to resource consumption. Allocate warehouse budget toward revenue-generating initiatives while limiting resources for exploratory or low-impact work.
Regularly evaluate ongoing project outcomes, reallocating resources when initiatives underdeliver. This ensures your analytics budget flows toward activities that drive measurable business results.
Implementing Cost Accountability
Visibility drives accountability. Consider establishing departmental or team cost budgets, creating ownership over spending patterns. When teams see their warehouse costs and understand budget constraints, they naturally make more efficient choices.
Create regular cost review processes where teams discuss spending trends, share optimization wins, and collaboratively problem-solve budget challenges. Incentivize cost-saving behaviors by recognizing teams that deliver high-value analytics within budget constraints.
Measuring Success and Continuous Improvement
Key Metrics to Track
Track month-over-month cost reduction percentages to measure optimization impact. Monitor cost per query and cost per dashboard as efficiency indicators—improvements in these metrics signal increasingly efficient operations.
Calculate usage efficiency ratios that compare cost to business value delivered. Time saved through automation and optimization represents both cost savings and productivity gains that should be quantified and celebrated.
Stakeholder Communication
Create executive dashboards that provide leadership visibility into cost trends and optimization efforts. Demonstrate ROI by comparing spending before and after optimization initiatives, building compelling business cases for continued investment in monitoring and efficiency.
Share success stories across the organization, celebrating teams that achieve significant cost reductions while maintaining or improving analytics quality. These narratives reinforce the importance of cost-conscious development and inspire others to prioritize efficiency.
Continuous Improvement
Cost optimization isn't a one-time project—it's an ongoing discipline. Establish regular reviews of cost trends and patterns, iterating on optimization strategies as usage evolves. Stay updated on platform improvements from both Paradime and Looker, as new features often enable additional efficiency gains.
Scale best practices across the organization by documenting what works, creating templates for efficient implementations, and building communities of practice where teams share knowledge and learn from each other's experiences.
Conclusion
Paradime Radar transforms Looker cost management from reactive crisis response to proactive optimization. By providing comprehensive visibility into explores, dashboards, usage patterns, and spending trends, Radar empowers teams to make data-driven decisions about resource allocation and optimization priorities.
The strategies outlined in this guide—from model optimization and strategic caching to dashboard refinement and cultural change—work synergistically to reduce warehouse spending while maintaining high-performance analytics. Organizations implementing these practices routinely achieve 20%+ cost reductions while simultaneously improving user experience and development velocity.
Start your optimization journey by setting up Looker monitoring in Paradime Radar, establishing baseline metrics, and identifying your top spending explores and dashboards. With consistent monitoring, strategic optimization, and a cost-conscious culture, you'll transform your Looker implementation into a lean, efficient analytics engine that delivers maximum business value per dollar spent.


