Introduction
Paradime is an AI-powered analytics workspace that consolidates the entire analytics workflow into one unified platform. With features like the Code IDE powered by DinoAI co-pilot, Bolt for production-grade orchestration, and Radar for real-time monitoring, Paradime helps analytics teams achieve 10x productivity gains while reducing warehouse costs by 20%+. Trusted by companies like Zeelo, Emma, and Motive, Paradime eliminates tool sprawl by bringing together dbt development, orchestration, and observability in a single interface.
Understanding Mermaid Diagrams and Why They Matter for dbt Projects
Data documentation has long been a pain point for analytics engineers. Traditional diagramming tools require constant context switching, manual updates, and exist outside your codebase—making them quickly outdated and disconnected from your actual data models.
Enter Mermaid.js: a JavaScript-based diagramming library that renders text definitions into visual diagrams. Unlike drag-and-drop tools, Mermaid treats diagrams as code—meaning your visualizations live in your repository, version alongside your dbt models, and update as easily as any other file.
For dbt projects, this diagram-as-code approach offers transformative benefits. Entity Relationship Diagrams (ERDs) can be stored in .mmd files, tracked in Git, reviewed in pull requests, and rendered natively in GitHub and dbt documentation sites. When your data models change, your diagrams can change with them—no more outdated PowerPoint slides or forgotten Lucidchart links.
The text-based nature of Mermaid also enables automation. Instead of manually drawing boxes and arrows, you can programmatically generate diagrams from your data model metadata, ensuring accuracy and saving countless hours of manual work.
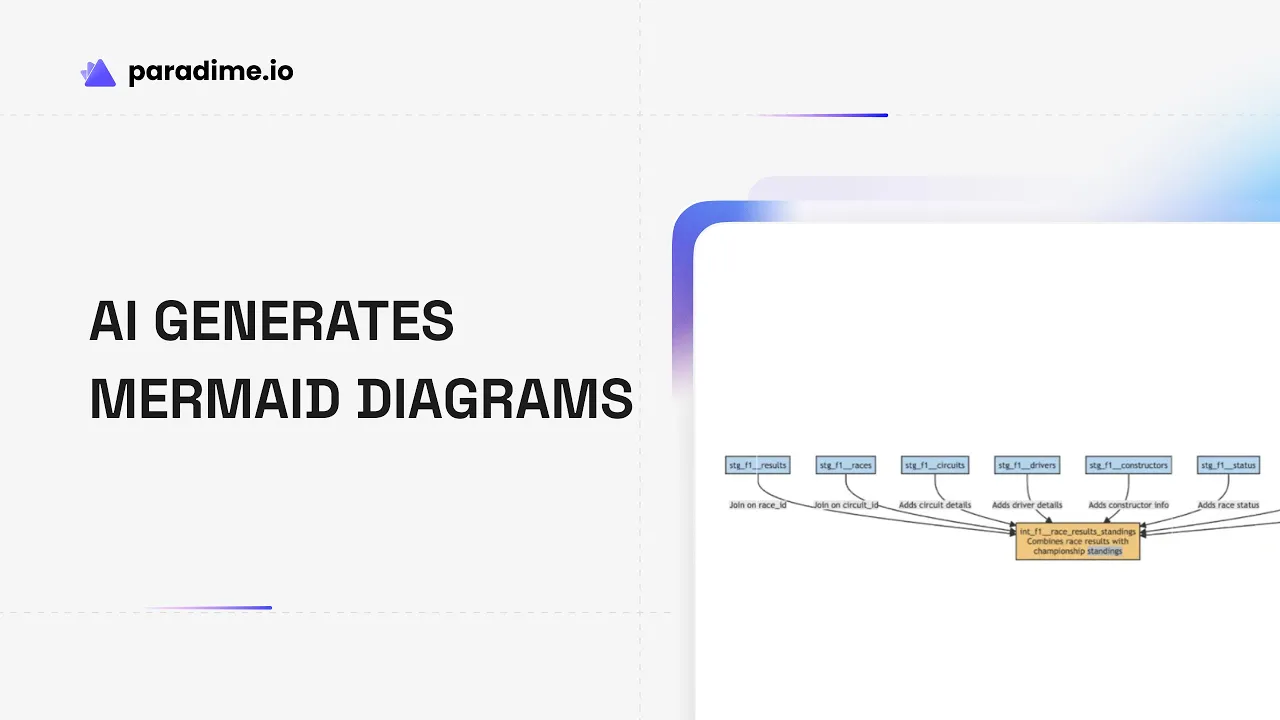
Introducing DinoAI's Automated Mermaid Diagram Generation
Paradime takes Mermaid diagrams to the next level with DinoAI, an AI copilot that automatically generates accurate ERDs for your dbt models with a single click. No need to learn Mermaid syntax or manually map relationships—DinoAI analyzes your model definitions, understands table relationships, and creates publication-ready diagrams instantly.
The workflow is remarkably simple. Within the Paradime Code IDE, you can invoke DinoAI using built-in shortcuts to generate a Mermaid diagram for any dbt model. DinoAI examines your model's YAML configuration, column definitions, and relationship tests to construct an accurate visual representation of your data structure.
What sets this apart is the seamless integration. DinoAI provides a built-in preview panel where you can see your diagram rendered in real-time as you make adjustments. The generated .mmd files are stored alongside your dbt code, making them part of your project's documentation ecosystem rather than isolated artifacts.
For teams already using dbt docs, these Mermaid diagrams integrate beautifully, appearing in markdown files and documentation sites with zero additional configuration. It's documentation that lives where your code lives.
Key Features That Accelerate Documentation Workflows
DinoAI's Mermaid diagram capabilities extend far beyond basic ERD generation. The AI-powered creation eliminates the need to memorize Mermaid syntax—just describe what you want, and DinoAI handles the technical implementation.
Real-time preview functionality provides instant feedback. As you refine your diagram descriptions or adjust generated code, you see results immediately in the integrated preview pane. This tight feedback loop makes iteration quick and painless.
Version control integration means every diagram change is tracked, reviewed, and reversible. When you commit your dbt code changes, your updated diagrams go with them, maintaining perfect synchronization between documentation and implementation.
Beyond ERDs, Mermaid supports multiple diagram types—flowcharts for data pipeline architecture, sequence diagrams for orchestration flows, and Gantt charts for project planning. DinoAI can generate any of these based on natural language prompts.
Custom structured prompts through .dinoprompts files enable standardized templates across your team. Create reusable prompt definitions that incorporate variables like model names and file paths, ensuring consistent documentation patterns organization-wide.
Collaborative documentation becomes effortless when diagrams live in code. Team members can suggest improvements via pull requests, comment on specific diagram elements, and see the evolution of your data architecture over time—all through familiar Git workflows.
Step-by-Step: Generating Your First Mermaid Diagram
Getting started with DinoAI's diagram generation takes just minutes. First, open your dbt project in the Paradime Code IDE and navigate to the model you want to visualize.
Access the DinoAI copilot by clicking the AI assistant icon or using the keyboard shortcut. You'll see a library of pre-built actions, including "Generate a mermaid diagram for a dbt model."
Select this shortcut and specify which model you want to visualize. DinoAI will analyze the model's structure, examining column definitions, data types, and any defined relationships in your schema YAML files.
Within seconds, DinoAI generates the Mermaid code and displays a preview of your ERD. Review the diagram to ensure it accurately represents your data structure. If you need adjustments—perhaps to highlight specific relationships or add annotations—you can modify the Mermaid code directly or provide additional instructions to DinoAI.
Once satisfied, save the diagram as a .mmd file in your project. Convention suggests storing these alongside your models or in a dedicated docs/ directory. Commit the file to version control, and it's immediately available to your entire team.
When you generate your dbt documentation site, Mermaid diagrams are automatically rendered, providing visual context right where stakeholders need it.
Real-World Use Cases for Automated Diagram Generation
The applications of AI-generated Mermaid diagrams span the entire analytics lifecycle. For complex data models with dozens of tables and hundreds of relationships, automated ERD generation provides clarity that would take hours to create manually.
Visualizing data lineage becomes straightforward when you can quickly generate flowcharts showing how data transforms from raw sources through staging layers to final marts. These diagrams make impact analysis trivial—you can see at a glance which downstream models are affected by upstream changes.
Architecture diagrams help communicate your data pipeline design to engineering teams, executives, and external stakeholders. Instead of maintaining separate documentation, you can generate current-state architecture views directly from your dbt project.
For data governance initiatives, entity relationship diagrams document database schemas with precision, helping compliance teams understand data flows and identify sensitive information. The version-controlled nature provides an audit trail of schema evolution.
Onboarding new team members accelerates dramatically when they can see visual representations of your data warehouse. Rather than parsing hundreds of YAML files, new analysts can review ERDs that map the conceptual landscape, then dive into specific models as needed.
The Productivity Benefits of AI-Powered Documentation
Speed improvements are dramatic. What once took hours of manual diagramming now takes seconds. Analytics engineers report creating diagrams 10x faster with DinoAI compared to traditional tools, freeing time for higher-value modeling work.
Accuracy increases because AI-generated diagrams reflect actual model structure rather than someone's potentially outdated understanding. When diagrams are generated from source metadata, they can't be wrong about table names, column types, or defined relationships.
Consistency across documentation improves when templates enforce standards. With .dinoprompts, you define once how ERDs should look for staging models versus marts, then apply that standard automatically across hundreds of models.
Collaboration friction disappears. Sharing a diagram is as simple as sharing a link to a file in your repository. Updates propagate instantly—no more emailing new versions or maintaining a mess of similar-but-different diagrams across multiple tools.
Maintenance burden drops dramatically. When you add a column or change a relationship, updating the diagram means regenerating it with DinoAI—a 10-second task instead of a 10-minute exercise in remembering where that Lucidchart file lives.
Clarity in cross-team communication improves when business stakeholders can see visual representations of data structures. ERDs translate technical model definitions into intuitive visuals that non-technical audiences understand.
Best Practices for Mermaid Diagrams in Your dbt Project
Strategic diagram creation focuses on high-value use cases. Not every model needs a diagram—prioritize complex models where visual representation adds clarity, staging layers that consolidate multiple sources, and marts that stakeholders frequently query.
Naming conventions matter for discoverability. Consider patterns like model_name_erd.mmd or organizing diagrams in a folder structure that mirrors your dbt project organization: docs/staging/, docs/marts/, etc.
Integration with dbt documentation sites happens automatically when you reference Mermaid files in model descriptions or overview pages. Use markdown syntax to embed diagrams directly in your generated documentation.
Enforcement through .dinorules files ensures diagrams get created. You can define a rule that complex models with more than a certain number of joins must include an ERD, and DinoAI will remind developers to create one.
Reusable prompts save time and ensure quality. Build a library of .dinoprompts for common diagram types—a standard ERD template, a lineage flowchart format, an architecture overview structure. Team members can invoke these with a single command.
Sharing through dbt docs and GitHub makes diagrams accessible. When diagrams live in your repository, they appear in code reviews, render in README files, and integrate into your documentation site—reaching audiences wherever they work.
Why Diagram-as-Code Beats Traditional ERD Tools
Compared to standalone tools like SqlDBM or dbdiagram.io, diagram-as-code offers fundamental advantages. Traditional tools exist outside your workflow, requiring exports, imports, and manual synchronization that inevitably fails.
The diagram-as-code approach keeps documentation and code together. When you update a model, your diagram is right there, ready to update. No separate app to launch, no separate file to track down, no wondering if the diagram reflects current reality.
Integrated tools like Paradime outperform standalone solutions because they understand your context. DinoAI knows your dbt project structure, can read your YAML files, and generates diagrams that accurately reflect your specific models—no manual data entry required.
Cost savings are substantial. Traditional diagramming tools charge per user and require licenses for every team member who needs to view or edit diagrams. Diagram-as-code requires no additional tools—just your text editor and version control system you already use.
Time savings compound over project lifecycles. Initial diagram creation might be slightly faster in a visual tool, but the ongoing maintenance burden with traditional approaches quickly overwhelms any early advantage. Automated regeneration beats manual updates every time.
Advanced Features: Custom Prompts and Standardization
Building your own AI prompts library unlocks team-specific efficiencies. .dinoprompts files define reusable templates that incorporate variables like {model_name} or {file_path}, automatically filling context when invoked.
Variable integration enables dynamic diagram generation. Instead of hardcoding model names, your prompts can reference the current file, selected text, or project metadata, making templates truly reusable across your entire codebase.
Different diagram types serve different purposes. Sequence diagrams visualize orchestration and job dependencies. Architecture diagrams show how components fit together. Gantt charts track project timelines. DinoAI can generate any Mermaid diagram type from natural language descriptions.
Team-wide standardization through .dinoprompts ensures everyone generates similar diagrams. Define your organization's preferred ERD style once, then every team member produces consistent output, improving documentation cohesion.
Enforcement through .dinorules goes beyond suggestions. You can require specific models to have diagrams, define naming conventions that must be followed, or mandate that pull requests include diagram updates when models change significantly.
Integration with the Complete Paradime Platform
Mermaid diagrams complement other Paradime Code IDE features to create a comprehensive development environment. DinoAI doesn't just generate diagrams—it also writes documentation, creates tests, and helps refactor models, all working together to accelerate your workflow.
When combined with Bolt orchestration, diagrams can visualize job dependencies and execution flows. See which models run in parallel, which are serialized, and where potential bottlenecks exist—all generated automatically from your orchestration configuration.
Radar monitoring provides column-level lineage visualization that extends diagram capabilities. While Mermaid diagrams show model-to-model relationships, Radar traces specific columns from source systems through transformations to final BI tools, creating end-to-end visibility.
Impact analysis becomes visual when you combine lineage data with automatically generated diagrams. Before making a breaking change, generate an updated architecture diagram showing affected downstream models, helping you plan communication and coordinate deployments.
The end-to-end documentation story ties everything together. From automatically generated model descriptions to ERD diagrams to lineage visualization to freshness monitoring, Paradime provides complete context for understanding your data warehouse.
Getting Started with DinoAI and Mermaid Diagrams
Setting up Mermaid support in your Paradime workspace requires no configuration—it's built in and ready to use. Simply open any dbt project in the Code IDE and you have immediate access to diagram generation capabilities.
Accessing DinoAI's diagram generation features is as simple as invoking the copilot and selecting from pre-built shortcuts. The interface guides you through the process, making it approachable even for team members new to Mermaid syntax.
Resources for learning Mermaid syntax are abundant, though with DinoAI you rarely need to write it manually. The official Mermaid.js documentation at mermaid.js.org provides comprehensive examples. GitHub also natively renders Mermaid in markdown files, making it easy to experiment.
Community support flourishes around both Mermaid and Paradime. The Paradime Slack community shares best practices, custom prompts, and creative diagram applications. You'll find .dinoprompts templates and real-world examples from teams across industries.
Next steps for improving your documentation workflow start small. Generate an ERD for one complex model and share it with your team. Add a few diagrams to your dbt docs site. Create a standardized .dinoprompts template for your most common diagram needs. As you see the benefits—faster onboarding, clearer communication, easier maintenance—expand adoption across more models.
The future of analytics documentation is visual, version-controlled, and automated. With DinoAI's Mermaid diagram generation, that future is available today—transforming data documentation from a dreaded chore into an automated benefit that makes your entire team more productive.


