Introduction to Paradime
Paradime is an AI-powered workspace that consolidates your entire analytics workflow into a unified platform—think "Cursor for Data." It eliminates tool sprawl and fragmented setups by integrating a Code IDE with DinoAI (your AI co-pilot for SQL and documentation), Paradime Bolt for production-grade orchestration with declarative scheduling, and Paradime Radar for comprehensive monitoring with column-level lineage and real-time alerts. Teams using Paradime achieve 50-83% productivity gains, 10x faster shipping speeds, and 20%+ reductions in warehouse spending compared to fragmented toolchains. With native integrations to Looker, Tableau, and the modern data stack, Paradime helps data teams ship faster without context-switching between VSCode, dbt Cloud, Airflow, and multiple monitoring tools.
Video Tutorial: Complete Walkthrough of the Models Dashboard
[Embed YouTube video: https://youtu.be/n8X2tx6DlEc?si=03NXT-lfYF1ozI9O]
Master your dbt model performance with this comprehensive video walkthrough of Paradime's Radar Models Dashboard. This tutorial covers everything from analyzing materialization types to tracking execution efficiency and identifying optimization opportunities.
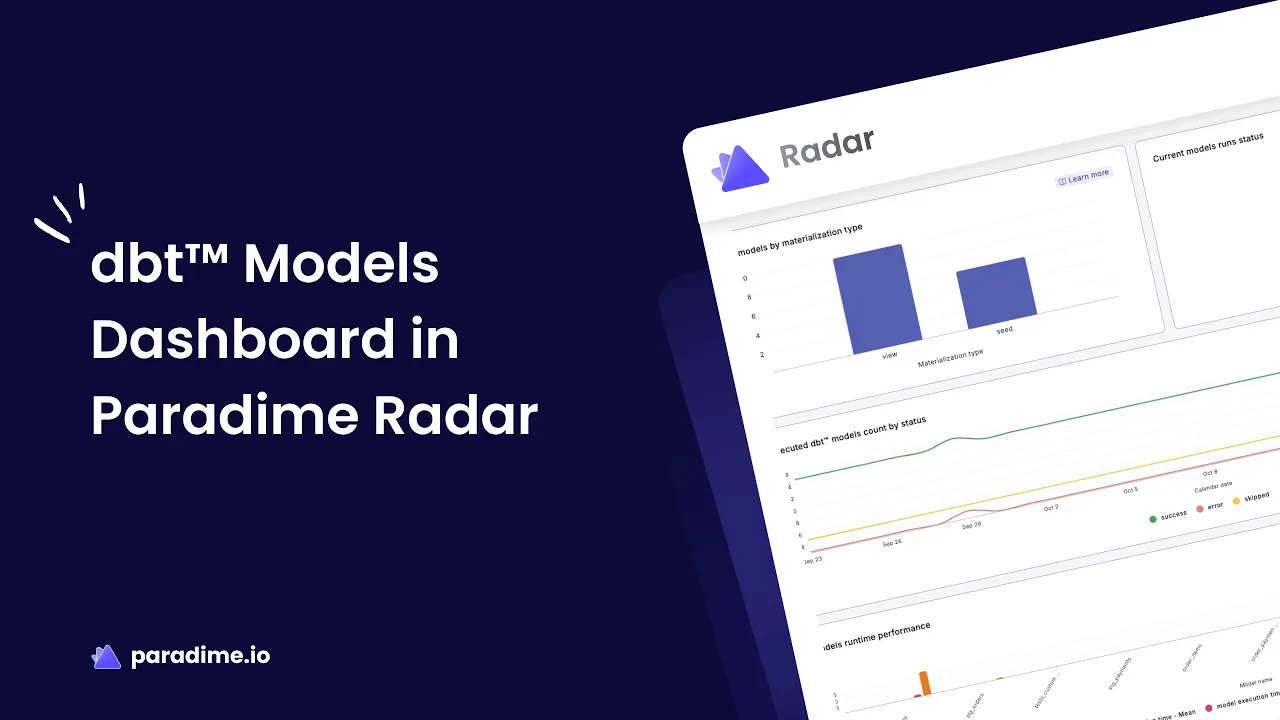
What is the Paradime Radar Models Dashboard?
Overview of Models Dashboard Capabilities
The Paradime Radar Models Dashboard provides comprehensive insights into your dbt model performance and dependencies, enabling you to monitor execution efficiency, analyze materialization strategies, and identify bottlenecks across your data pipeline. The dashboard is divided into two main sections: an Overview section for high-level summaries of all models, and a Detailed section for in-depth analytics on individual model performance.
This powerful monitoring tool transforms raw execution data into actionable insights, helping analytics engineers make data-driven decisions about model optimization, resource allocation, and pipeline reliability.
Why Model Performance Monitoring Matters
Without proper monitoring, data teams struggle with unpredictable pipeline failures, excessive warehouse costs, and delayed delivery of analytics. The Models Dashboard empowers analytics engineers to make data-driven decisions by surfacing critical metrics like execution duration trends, failure patterns, and resource utilization—helping teams maintain reliability while optimizing performance.
In modern analytics environments, where data volumes grow exponentially and business demands for faster insights increase, understanding model performance is no longer optional. It's the difference between a team that reacts to problems and one that prevents them proactively.
Key Features of the Models Dashboard
Overview Section: High-Level Model Analytics
Execution Efficiency and Reliability Tracking
Monitor daily success rates, error occurrences, and skipped runs across all your dbt models. The dashboard highlights time-intensive models and tracks execution failures, giving you immediate visibility into pipeline health. This bird's-eye view helps you quickly identify which models need attention and prioritize your optimization efforts effectively.
Materialization Strategy Analysis
Review the distribution of materialization types across your models—including tables, views, incrementals, and snapshots. This analysis helps you identify opportunities to optimize resource usage and reduce warehouse costs by ensuring each model uses the most appropriate materialization strategy. Understanding your materialization mix is crucial for balancing performance needs with compute costs.
Model Failure Analysis
Quickly identify which models have the highest failure counts, enabling you to prioritize troubleshooting efforts and investigate common causes of failures across problematic models. The dashboard surfaces failure patterns that might otherwise go unnoticed in individual execution logs, helping you address systemic issues before they cascade downstream.
Schedule Dependency Insights
Understand how your models are utilized across different schedules, helping you optimize orchestration logic and prevent unnecessary model reruns. This feature reveals which models are invoked by multiple schedules, allowing you to consolidate runs and reduce redundant compute.
Detailed Section: Deep-Dive Model Performance
Model Reliability Metrics
Track success rates, invocation counts, duration trends, and error patterns for individual models over time. These metrics help you establish baseline performance expectations and detect anomalies before they impact downstream analytics. By monitoring these indicators consistently, you can spot degradation patterns early and intervene before they escalate into production incidents.
Execution Time Analysis
Identify peak execution times and potential bottlenecks in your data pipeline. Understanding when models run slowest helps you optimize query logic or adjust scheduling to avoid resource contention. This temporal analysis reveals whether performance issues stem from the model itself or from competing workloads during busy periods.
Model Invocation Trends
Monitor the frequency and success rate of model executions over time, helping you understand usage patterns and identify models that may be running more frequently than necessary. Correlating invocation trends with business activities can reveal opportunities to optimize scheduling based on actual data freshness requirements.
Schedule Execution Details
View detailed information about commands, configurations, and execution times across different schedules, enabling you to fine-tune orchestration settings for optimal performance. This granular view helps you understand how the same model performs under different configurations, informing smarter orchestration decisions.
How to Use the Models Dashboard Effectively
Setting Up Your Dashboard
Before accessing the Models Dashboard, ensure you've completed the dbt Monitoring setup in Radar's Get Started guide. Once configured, navigate to the Radar section of your Paradime workspace to access comprehensive model insights. The setup process integrates seamlessly with your existing dbt project, requiring minimal configuration to start surfacing valuable performance data.
Filtering and Navigation
Apply filters by date range to analyze performance trends over specific time periods. Use model selection filters to focus on particular areas of your dbt project, whether by team ownership, data domain, or criticality to business operations. The intuitive filtering interface makes it easy to drill down from high-level trends to specific model investigations.
Located at the top of the dashboard, the "Select date range" and "Select a model" dropdowns let you customize your view instantly. The dashboard automatically updates to reflect your selections, providing immediate feedback as you explore different time windows or model subsets.
Interpreting Performance Metrics
Learn to read key indicators like execution duration spikes, success rate declines, and failure count increases. Understanding what "normal" looks like for your models helps you quickly spot issues requiring attention. Establishing baseline performance expectations is critical—a 10-minute model that suddenly takes 30 minutes signals a problem, while a naturally variable model might fluctuate without concern.
Pay attention to trends over time rather than isolated incidents. A single failure might be a transient issue, but a declining success rate over weeks indicates a deeper problem requiring investigation.
Practical Use Cases for Model Performance Optimization
Identifying and Resolving Bottlenecks
Use execution time analysis to pinpoint models that consume disproportionate resources. Investigate query logic, examine data volumes, and consider optimization techniques like incremental processing or table partitioning to improve performance. Often, a small subset of models accounts for the majority of compute costs—identifying and optimizing these high-impact models yields significant returns.
Look for models whose execution times grow faster than data volumes. This pattern suggests inefficient query patterns that will only worsen over time, making them priority candidates for refactoring.
Optimizing Materialization Strategies
Review your materialization distribution to ensure alignment with best practices. Consider converting rarely-changed dimension tables from incremental to table materializations, or switch lightweight transformation models from tables to views to reduce storage costs.
Table materializations work best for models with complex transformations that are queried frequently, as they store physical copies for fast access. View materializations suit lightweight transformations and infrequently-accessed models, eliminating storage costs at the expense of query-time computation. Incremental materializations excel for large, append-only datasets where reprocessing everything would be prohibitively expensive. Snapshots capture historical states of slowly changing dimensions.
The Models Dashboard's materialization analysis reveals whether your current strategy aligns with these best practices, highlighting opportunities to right-size your approach for each model's actual usage pattern.
Reducing Model Failures
Focus on models with high failure counts to understand root causes. Common issues include upstream dependency failures, schema drift, data quality problems, or resource timeout errors. The dashboard's detailed execution logs help you diagnose and resolve these issues efficiently.
When investigating failures, look for patterns: Do failures cluster around specific times of day? Do they correlate with upstream data refreshes? Does the same subset of models fail together? These patterns point toward systemic issues—like insufficient warehouse resources during peak hours—rather than model-specific bugs.
Improving Pipeline Efficiency
Analyze schedule dependency insights to identify redundant model runs or opportunities to consolidate scheduling logic. Optimize your paradime_schedules.yml configuration to reduce unnecessary compute while maintaining freshness SLAs.
Models that run on multiple schedules may be candidates for consolidation. If three different schedules all invoke the same upstream model, consider restructuring your orchestration to run it once and share the result, dramatically reducing redundant processing.
Troubleshooting Common dbt Model Issues
Diagnosing Execution Failures
When models fail, the dashboard provides error patterns and execution logs to help you quickly identify whether issues stem from query syntax errors, permission problems, resource constraints, or upstream data quality issues. Rather than searching through disparate logs, the centralized failure analysis surfaces patterns across multiple executions, revealing whether you're dealing with an intermittent issue or a consistent problem.
Addressing Performance Degradation
Track duration trends to detect gradual performance degradation over time. This often indicates growing data volumes, inefficient query patterns, or the need to revisit incremental logic and lookback windows.
Performance degradation is particularly insidious because it happens slowly—what takes 5 minutes today might take 6 minutes next month and 10 minutes by next quarter. Without trending data, these gradual increases go unnoticed until they become critical. The Models Dashboard's time-series visualization makes these trends obvious, allowing you to address them before they impact SLAs.
Managing Resource Contention
Use peak execution time analysis to identify when multiple resource-intensive models compete for warehouse compute. Adjust scheduling to distribute load more evenly throughout the day. If the dashboard shows that five heavy models all kick off at midnight, staggering their start times can dramatically improve individual model performance and overall pipeline reliability.
Best Practices for Ongoing Model Monitoring
Establish Performance Baselines
Document expected execution times and success rates for critical models. Set up automated alerts through Paradime Radar's integration with PagerDuty, DataDog, or Slack to notify teams when models deviate from baseline performance. These baselines serve as your early warning system, catching anomalies before they cascade into broader pipeline failures.
Regular Dashboard Reviews
Schedule weekly or monthly dashboard reviews with your data team to identify trends, celebrate improvements, and prioritize optimization work. Use the insights to continuously refine your dbt project structure and configuration. Make these reviews a collaborative exercise—different team members notice different patterns, and discussing them builds shared understanding of your pipeline's behavior.
Document Optimization Decisions
When you make changes based on dashboard insights—like adjusting materializations or refactoring queries—document the rationale and expected impact. Track whether optimizations achieve desired results and iterate accordingly. This documentation creates institutional knowledge, helping future team members understand why your project is structured the way it is.
Leverage Column-Level Lineage
Combine Models Dashboard insights with Paradime Radar's column-level lineage features to understand downstream impacts before making changes. The impact analysis shows which dashboards might break before you merge code, preventing production issues. This integration between performance monitoring and impact analysis creates a comprehensive view of both the "what" and the "so what" of your models.
When you identify a slow model that needs optimization, checking its downstream dependencies ensures your refactoring won't inadvertently break critical business dashboards. This safety net allows you to optimize confidently, knowing the full blast radius of your changes.
Get Started with Paradime Radar Today
Ready to take control of your dbt model performance? Paradime Radar's Models Dashboard provides the comprehensive monitoring and optimization capabilities your data team needs to ship faster, reduce costs, and maintain reliability. Start your free trial today to experience 10x faster development cycles and eliminate the tool sprawl that's slowing your team down.
Visit paradime.io to get started, or explore the documentation at docs.paradime.io to learn more about Radar's full suite of observability features. Transform your analytics workflow from reactive troubleshooting to proactive optimization, and join the teams already achieving dramatic productivity gains with Paradime's unified platform.


