Introduction
Paradime is an AI-powered workspace that consolidates the entire analytics workflow, often described as 'Cursor for Data'. It eliminates tool sprawl by bringing together code IDE, DinoAI co-pilot, and Paradime Bolt—a production-grade orchestration system. With features like column-level lineage, real-time monitoring, and automated alerts, Paradime helps teams achieve 50-83% productivity gains and 25-50% faster development cycles. By transforming dbt models into state-aware orchestration with declarative scheduling, Paradime ensures teams ship 10x faster with confidence.
Learn more about Paradime at: https://www.paradime.io/why-paradime
What is Paradime Bolt?
Production-Grade dbt Orchestration Platform
Modern data teams face a familiar challenge: coordinating multiple tools to move analytics from development to production. Paradime Bolt transforms dbt models into a production-grade, state-aware orchestration system with declarative scheduling through paradime_schedules.yml, robust CI/CD pipelines, and automated test runs.
Unlike traditional orchestration approaches that require juggling multiple platforms, Bolt provides a comprehensive solution that understands the state of your data pipelines and automatically manages dependencies between models.
Key Capabilities Beyond Traditional Tools
The traditional analytics workflow requires teams to coordinate between VSCode for development, dbt Cloud for transformations, Airflow for orchestration, Monte Carlo for data quality, and Looker for visualization. This tool sprawl creates friction, slows development cycles, and increases the risk of errors.
Paradime Bolt consolidates these workflows into a unified platform, eliminating the need to context-switch between tools and enabling teams to manage their entire analytics lifecycle from a single interface. This consolidation doesn't just improve convenience—it fundamentally transforms how teams build and maintain data pipelines.
AI-Powered Error Debugging with DinoAI
How DinoAI Debugging Works
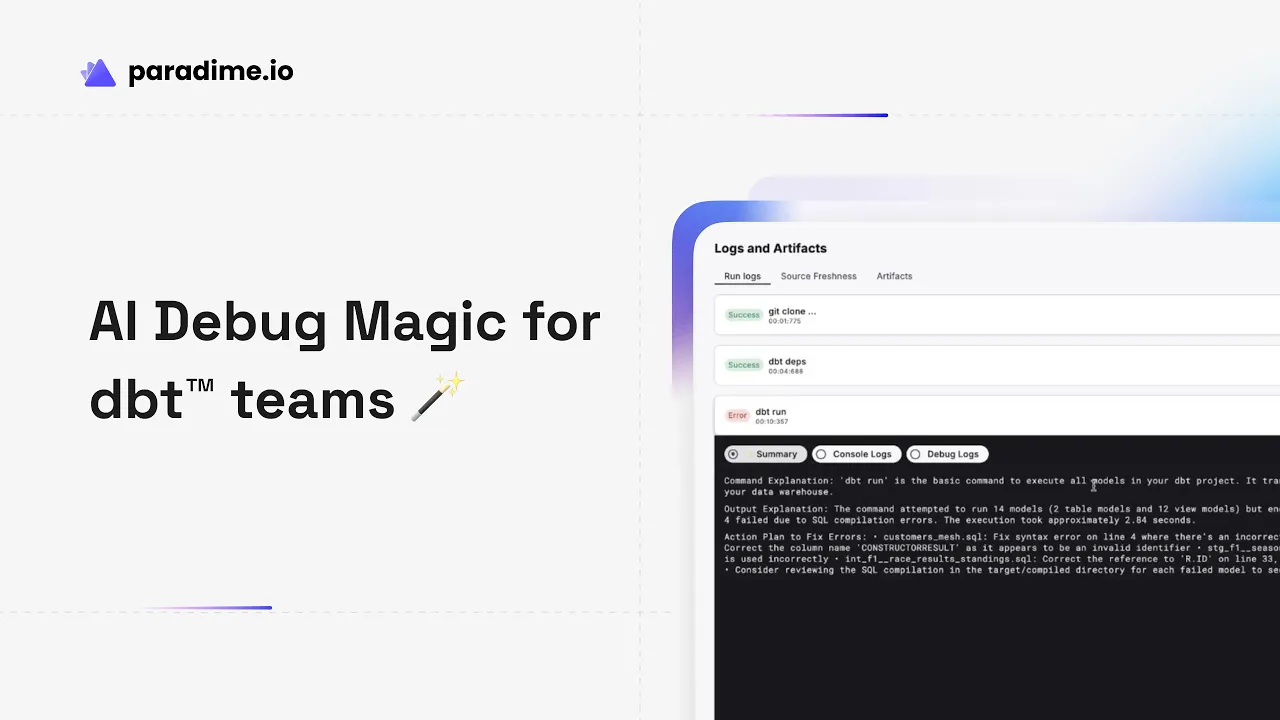
When pipeline failures occur at 2 AM, the last thing your on-call engineer wants to face is hundreds of lines of cryptic console output. DinoAI transforms this experience by providing human-readable error summaries with specific remediation steps, eliminating the need for teams to become expert debuggers.
Instead of parsing through stack traces and raw logs, DinoAI analyzes the failure context and translates technical errors into actionable guidance that any team member can understand and act upon.
Actionable Error Resolution
Consider a typical scenario: your staging model fails during a scheduled run. Traditional tools present a wall of error text that requires expertise to interpret. DinoAI instead delivers clear guidance like: "There's an invalid column reference in your staging model. Check line 15 where 'customer_id' is referenced—this column doesn't exist in the source table."
This specificity eliminates guesswork and enables immediate action. The AI doesn't just identify the problem—it pinpoints the exact location and provides context about what needs to be fixed.
Reducing Mean Time to Resolution (MTTR)
The impact is measurable: teams using DinoAI resolve errors 70% faster compared to other solutions. This dramatic improvement stems from eliminating the investigation phase—teams can move directly from recognizing a failure to implementing a fix.
This speed improvement has cascading benefits: reduced downtime, lower stress for on-call engineers, and more time focused on building new features instead of debugging production issues.
Accessing Debug Features
DinoAI's debugging capabilities are accessible through multiple entry points designed to fit naturally into your workflow:
Click the Dino AI icon in the Editor while viewing a problematic model
Use the
/fixcommand directly in the consoleRight-click any
.sqlfile and select "Fix model" from the DinoAI Copilot dropdown
This flexibility ensures teams can access AI assistance exactly when and where they need it, without disrupting their natural workflow patterns.
Complete AI Workflow Integration
DinoAI transforms on-call responsibilities from requiring specialized technical knowledge to following clear, AI-generated instructions. Junior engineers can resolve issues that previously required senior expertise, and senior engineers can focus their expertise on strategic problems rather than routine debugging.
The AI essentially creates a guided workflow from pipeline error to code fix, democratizing the debugging process and making data operations more resilient.
Python Commands and External Integrations
Python Script Execution
Data pipelines rarely consist solely of SQL transformations. Real-world analytics workflows require Python scripts for data ingestion, custom transformations, ML model scoring, and integration with external systems.
Paradime Bolt supports Python commands natively, enabling teams to run Python ingestion scripts before dbt transformations, execute custom data quality checks, or trigger machine learning pipelines—all within the same orchestration framework that manages your dbt models.
External Command Capabilities
Modern data operations extend beyond transformation. Teams need to refresh dashboards, sync data to operational systems, run data quality checks, and coordinate with monitoring tools. Bolt orchestrates all of these activities through external commands:
Power BI dashboard refreshes ensure business users see updated data without manual intervention
Tableau worksheet and data source refreshes keep visualizations current automatically
Reverse ETL syncs push transformed data back to operational systems like Salesforce or HubSpot
Integration with monitoring tools like Monte Carlo for data quality checks
This comprehensive capability set eliminates the need for separate orchestration tools like Airflow for non-dbt workflows.
Available Command Types
Paradime Bolt supports 12+ command types that cover the full spectrum of data operations:
dbt Commands (models, tests, snapshots)
Airbyte Connector Sync
Elementary Commands (data quality)
Fivetran Connector Sync
Lightdash Commands
Microsoft Power BI Dataset Refresh
Monte Carlo Commands
Paradime Bolt Schedule Toggle
Paradime Refresh Catalog
Python Scripts
Tableau Workbook Refresh
Tableau Data Source Refresh
Each command type integrates seamlessly with Bolt's scheduling and monitoring infrastructure, providing consistent management regardless of the underlying technology.
Multi-Command Configuration
Real data pipelines require orchestrating multiple steps in sequence or parallel. Bolt enables teams to define one or more commands per schedule, either in separate lines for sequential execution or as multiple command blocks for complex dependency graphs.
Dependencies are handled automatically—when you reference dbt packages, Bolt runs dbt deps automatically to ensure all dependencies are installed before execution. This automation eliminates an entire class of "it works on my machine" issues that plague traditional orchestration approaches.
End-to-End Data Workflow Orchestration
The true power emerges when combining these capabilities. A single Bolt schedule can:
Run a Python script to ingest data from an API
Execute dbt transformations to model that data
Run Elementary data quality checks
Refresh Tableau dashboards with the new data
Sync selected data back to Salesforce via reverse ETL
This comprehensive approach eliminates the need to coordinate multiple tools, reducing complexity and potential failure points while providing a single pane of glass for monitoring and troubleshooting.
Advanced Scheduling and Monitoring
Timezone-Aware Global Scheduling
Modern data teams operate across time zones, but data pipelines need to run at specific times relative to business operations. Bolt provides timezone-aware scheduling that ensures pipelines run at the correct times regardless of team location.
Schedule your pipeline to run at 9 AM Eastern time, and it will always run at 9 AM Eastern—even when daylight saving time changes or when team members are working from different regions.
Automated Alerts and Integrations
Production data pipelines require active monitoring and rapid response to failures. Bolt integrates with the tools teams already use for incident management:
PagerDuty for critical pipeline failures that require immediate attention
DataDog for metrics and observability
Slack for team notifications and collaboration
Jira and Linear for ticket creation and tracking
These integrations create a complete data pipeline management system where failures automatically create tickets, notify relevant team members, and provide all necessary context for resolution.
Automatic Orchestration Triggers
One of the most powerful features of native integration is automatic triggering. When upstream dbt models complete successfully, Bolt can automatically trigger dashboard refreshes in Looker and Tableau—eliminating manual refresh processes and ensuring business users always see the freshest data.
This automation extends beyond BI tools to any downstream system that depends on transformed data, creating truly event-driven data architectures.
Impact Analysis and Lineage
Column-Level Lineage Tracking
Understanding how data flows through your analytics stack is crucial for maintaining data quality and making confident changes. Bolt provides column-level lineage from source databases through dbt transformations to BI tools.
This granular tracking enables teams to answer critical questions: Where does this dashboard metric come from? Which source tables feed this report? What will break if I change this column?
Pre-Merge Impact Analysis
The most valuable time to understand impact is before changes reach production. Bolt's pre-merge impact analysis shows exactly which Looker dashboards or Tableau reports will be affected by proposed code changes—before merging.
This capability prevents production incidents by surfacing breaking changes during code review, when they're easiest and cheapest to fix. Teams can make informed decisions about whether to proceed with changes, update downstream dependencies, or refactor their approach.
CI/CD with Lineage Diff
Automated CI/CD pipelines leverage column-level lineage diff to avoid downtime. When a pull request is opened, Bolt automatically analyzes the proposed changes and shows exactly what will be affected, creating a detailed impact report that reviewers can use to assess risk.
This automation transforms CI/CD from a testing-only process to a comprehensive change management system that protects production while enabling rapid iteration.
Performance Benefits and Cost Savings
Development Speed Improvements
The productivity gains from Paradime's integrated approach are substantial and measurable. Teams consistently report 25-50% faster development cycles, with specific tasks seeing even more dramatic improvements—operations that previously took 4 hours dropping to just 5 minutes.
These efficiency gains come from eliminating context switching, automating routine tasks, and providing AI assistance for common challenges. The cumulative effect is that teams can ship 10x faster without sacrificing quality.
Warehouse Cost Optimization
Better orchestration leads to better query patterns, which directly impacts warehouse costs. Teams using Paradime Bolt report 20%+ reductions in warehouse spending through more efficient scheduling, elimination of redundant runs, and AI-powered query optimization suggestions.
As cloud data warehouse costs continue to grow, these optimizations deliver immediate ROI that can offset tooling costs entirely.
Production Reliability
Perhaps the most valuable benefit is what doesn't happen: fewer production incidents, shorter outages, and reduced on-call burden. Robust error handling, automated testing, and AI-powered debugging ensure pipelines run reliably, transforming data operations from reactive firefighting to proactive optimization.
Getting Started with Paradime Bolt
Setting Up Your First Schedule
Getting started with Bolt is straightforward. Create a paradime_schedules.yml file in your dbt project to define when and how your dbt models and Python scripts should run. The declarative syntax makes schedules easy to understand and version control:
Configuring Command Settings
Each command in a schedule can be configured with specific targeting using --target flags to point to different data warehouse connections, allowing separate staging and production environments with different refresh cadences.
Combine dbt commands with Python scripts and external integrations to build complete workflows that handle every aspect of your data pipeline.
Implementing Best Practices
Leverage Bolt's automatic dependency installation to ensure packages are always current, use multi-command configurations to build complex workflows, and implement robust error handling with automated alerts to build resilient production pipelines.
Start simple with basic dbt orchestration, then gradually add Python scripts, external integrations, and advanced monitoring as your needs evolve.
Conclusion
The Future of Data Orchestration
Paradime Bolt represents the next generation of data orchestration—combining AI-powered debugging, Python flexibility, and comprehensive integrations into a single unified platform. This consolidation addresses the core challenge facing modern data teams: tool sprawl that creates friction, slows development, and increases operational burden.
By bringing together orchestration, monitoring, debugging, and lineage tracking, Bolt enables teams to operate with confidence and speed previously impossible with fragmented toolchains.
Why Teams Choose Paradime Bolt
The benefits are concrete and measurable: 70% faster error resolution, 25-50% faster development cycles, 20%+ warehouse cost savings, and 50-83% productivity gains. These aren't theoretical improvements—they're outcomes that teams report consistently after adopting Paradime.
Beyond the metrics, teams choose Bolt because it transforms daily work. Junior engineers can resolve issues that previously required senior expertise. On-call rotations become less stressful. Development cycles accelerate without sacrificing quality. Data operations shift from reactive firefighting to proactive optimization.
Taking the Next Step
Start building modern data pipelines that go beyond traditional dbt orchestration. Leverage AI assistance to debug faster, use Python capabilities to extend beyond SQL transformations, and implement seamless integrations to orchestrate your entire data stack from a single platform.
The future of data orchestration is here—and it's 10x faster, more reliable, and more cost-effective than the fragmented approaches of the past.


