The DinoAI advantage when Claude goes down
Every team building on a frontier model is making the same quiet bet: that the provider will be there when your users are. We counted every incident on Anthropic's public status page to see how often that bet gets tested — and what it costs when nobody designed for it.

Kaustav Mitra
·
5
min read

Anyone today building their own agents almost always makes a model choice and expects that the models are always available. We pulled ninety days of Anthropic's published incident history to see how often that assumption gets tested. In three months, the longest stretch with nothing wrong anywhere, this was 71 hours!
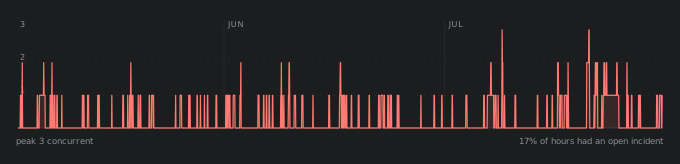
Concurrently open Claude API incidents
Hourly, 4 May - 30 July 2026, source: https://status.claude.com
01 - What the numbers say
Not a whole platform going down but rather one or another model getting overloaded with many API blips happening randomly.
We pulled the publicly available ninety days of Claude status page history and counted every reported incident that touched the API. Ninety days of Anthropic's public incident history contains 141 reported incidents. Forty-two of them(3%) were declared major or critical. Seventeen percent (17%) of all wall-clock hours had at least one incident open, and for forty of those hours, two or more were open at once.
But the pattern is not the one most integrations or internal developments are built against. It is not a platform that completely goes down occasionally. It is a platform where, on most days, some individual model is returning elevated errors while others stay perfectly healthy. Sixty-five percent of every incident in the window involved exactly one model.
That distinction is the whole crux of this post. A single model quietly failing at eight percent (8%) for ninety minutes looks, from inside your application, like intermittent errors. But when that error lands in the middle of a task, it's an irrecoverable failure and users get pretty annoyed when that happens. I know, I do :-).
None of this is a criticism of Anthropic. Every frontier provider is shipping capacity as fast as it can build it, and elevated error rates are what that looks like from the outside. However, as AI models are increasingly used for use cases where reliability is required, these intermittent errors are not acceptable.
Every reported incident, placed on the clock
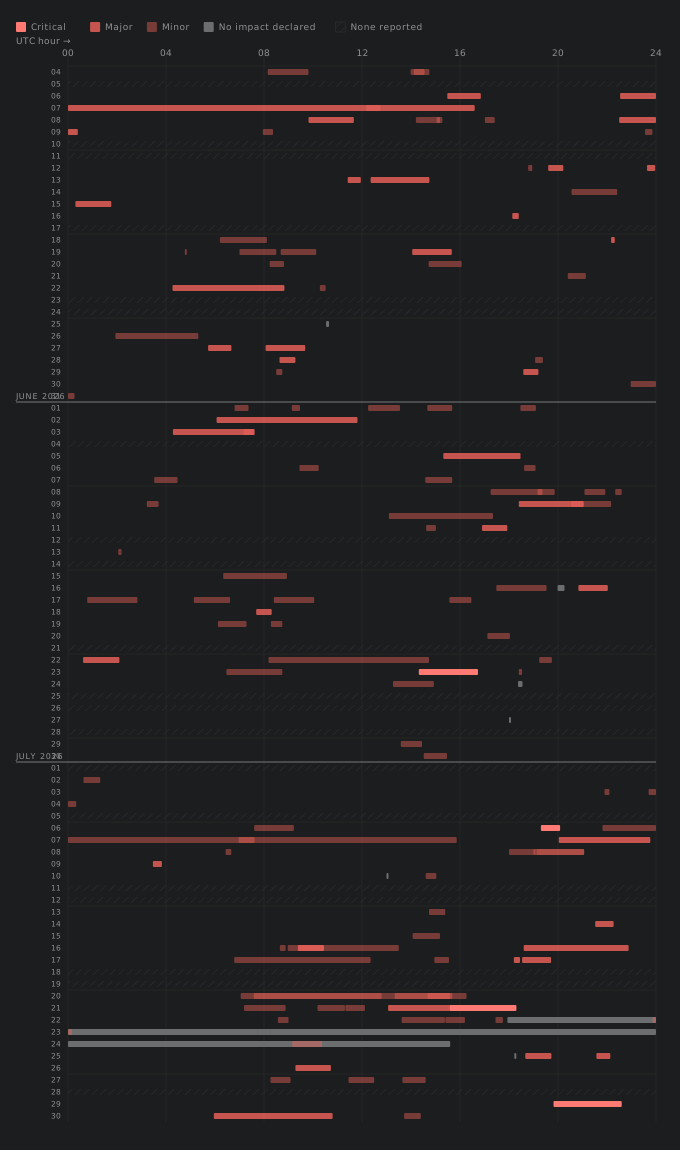
Figure 1 - Incident calendar
141 incidents, 88 days, one row per day, one bar per incident, sized by duration, coloured by declared impact, source: https://status.claude.com
Five incidents were declared critical: 23 June (multi-model, 2.4h), 6 July (Claude.ai, 0.8h), 21 July twice - several models for 2.7h and a services disruption for 0.4h - and 29 July (all models, 2.8h). The busiest single days were 21 and 22 July, with six separate incidents each.
One incident is excluded from every figure here: from 13 June to 1 July, Anthropic suspended access to Mythos 5 and Fable 5 to comply with export controls - 18.8 days flagged as degraded. That was a deliberate withdrawal, not a fault, and drawn as a bar it would swamp a fifth of the chart.
Two things jump out of that grid. The first is density:
Across the observed ninety day window, there is no clear day.
The second is distribution - the bars are short.
Model degradation happens every day, which feels like fighting small fires every day.
Most incidents are shorter than an hour
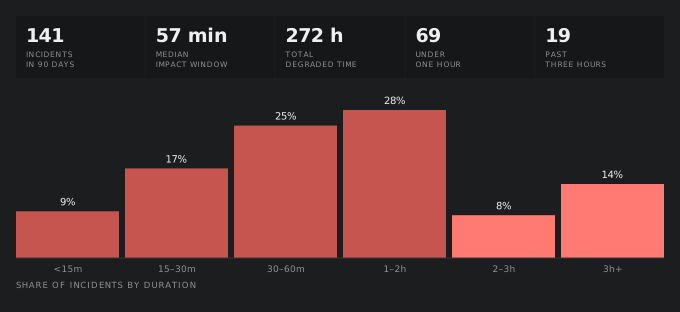
Figure 2 - Duration
Reported impact windows, bucketed, share of incidents in each bucket
Half of all incidents resolve inside 57 minutes, and only 14% run past three hours. Short windows are the dangerous ones. An incident long enough to notice gets handled by a human. An incident that opens and closes inside one agent turn gets handled by your retry logic, or not at all.
July, 2026 itself carried more than twice the degraded time of May or June.
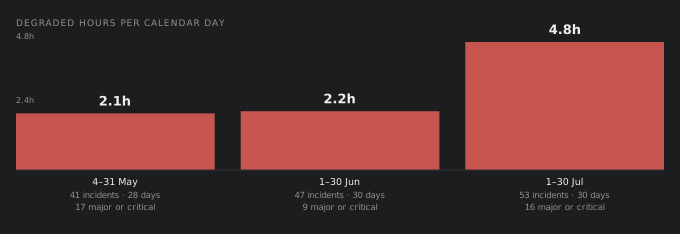
Figure 3 - Monthly load
Degraded hours normalised per calendar day, so partial months compare fairly
Incident count rises gently - 41, 47, 53 - but degraded hours per day more than doubles in July. Read the trend cautiously: three months is three data points, the severity mix moves the other way (17 major or critical in May against 9 in June), and both May and July are partial months, which is why the axis is per-day rather than per-month.
02 - What actually breaks?
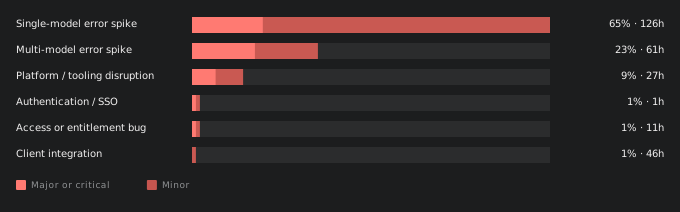
Figure 4 - Failure mode
Share of incidents by cause; darker segment is the portion declared major or critical
Half of all multi-model incidents were declared major or critical, against a fifth of single-model ones. Multi-model events are rarer and far more serious - and they are the ones a fallback strategy cannot route around, because there is nowhere healthy left to route to.
These short incidents cause noticeable disruption mid-workflow for most users. For teams running agent loops, this results in agents stopping midway of their work. If you don't have fault-tolerance built in, then your loops stop midway and then the perceived benefits of having agents to improve productivity is lost.
Opus 4.8 and 4.7 account for nearly half of every model mentioned
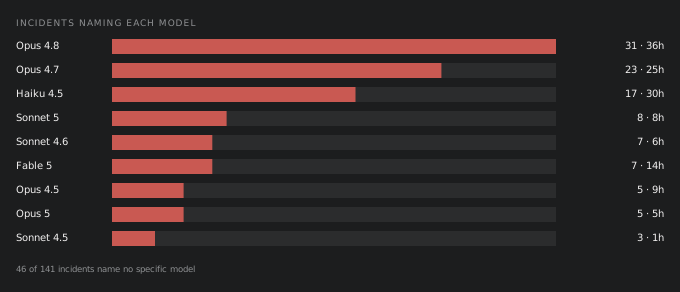
Figure 5 · Model exposure
Number of separate incidents naming each model, with total hours, an incident naming several models counts once for each.
Opus 4.8 and Opus 4.7 together account for 54 of the 113 model mentions across the window - 48%, against 59 for every other model combined. The heaviest models take the brunt. Haiku 4.5 is also interesting - it got fewer incidents than Opus 4.7 but more total hours, meaning its incidents run longer when they happen. 46 of the 141 incidents name no model at all - those are the platform, auth and tooling failures no model choice protects you from.
This is the chart that should shape your architecture. If your agent hard-codes a single model, this tells you exactly how much exposure you have bought. If it routes through a gateway, it tells you how you should design your failover strategy.
03 - The failure mode nobody designs for
A five-second blip is a permanently broken thread.
The naive integration with an AI provider is a single call to a single model. When that call fails, the user gets a spinner that never resolves, a stack trace, or - worst of all - a half-written answer that stops mid-sentence.
For a coding agent this is particularly brutal, because the failure lands mid-task. DinoAI has already read your dbt™ project, ran a query, analyzed your lineage, and started building a model. A transient error at that moment can corrupt the conversation itself that you have built on over time.
Agent frameworks maintain a strict invariant: every tool call must be paired with a tool result. Killing a stream halfway through, you leave an unpaired tool_use block in the history, which means the next request is rejected too, and every one after it. The provider could have recovered in seconds, but the thread would be dead regardless.
Users will forgive a provider having a bad minute. But they get pretty annoyed when they loose the ten minutes of context they had just built.
Same outage, two histories
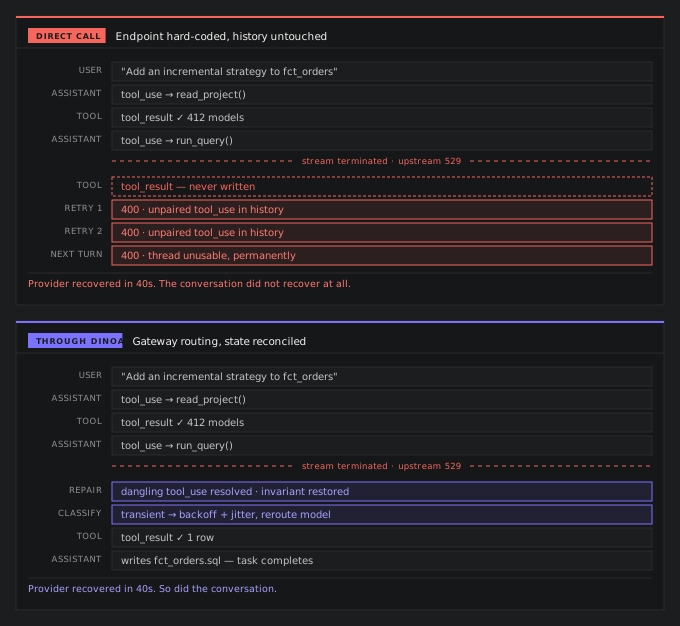
Figure 6 · Conversation state
What the message history looks like after a stream dies mid-tool-call.
This figure describes the architecture. A stream interrupted mid-tool-call leaves a thread in a degraded state that is still valid on the next request. With DinoAI, this state and context is never lost.
04 - How we approach it in DinoAI
DinoAI is Paradime's AI agent for analytics engineering. Without giving away the recipe, here is the how we have built our system.
TRIAGE - Classify before you react
Not every error needs a retry. We separate transient errors from terminal ones. Transient errors get retried with sensible defaults; terminal errors fail fast with a specific, actionable message. Blanket retry-everything logic is an immense overkill on the user experience.VALIDATION - Treat an empty response as a failure
We validate every response, not just the status code, and retry when it does not meet our validation criteria.
STATE - Repair conversation state before every call
The piece teams most often miss. Before each request, DinoAI reconciles the message history so the sequence is always valid across orphaned requests and dangling tool calls. Recovery is not "try again", it is making sure trying again does not loose the existing context.
ROUTING - Route through a gateway, not a hard-coded endpoint
We have built a smart and adaptive model routing layer with routing controlled by configuration rather than code. When a specific model is failing, and Figure 1 says one usually is, we adaptively move traffic without shipping a release. Figure 5 is why that matters: across this window Opus 4.8 appears in ten times as many incidents as Sonnet 4.5.
TRANSPARENT - Be clear when nothing works
After retries are exhausted, DinoAI does not hang or show a stack trace. It says plainly that the AI provider is overloaded, that this is not a Paradime problem, and to try again shortly. In our experience, timely and clear messages are appreciated by users instead of getting confused.
05 - What have we caught
Eighty-nine and a half percent of failures never reached a user.
The three months above are Anthropic's account. This is ours, from the same window - narrowed to the only thing that matters here. We counted AI provider-side failures and across the last thirty days there were 579 of them.
How DinoAI did on Claude's bad days
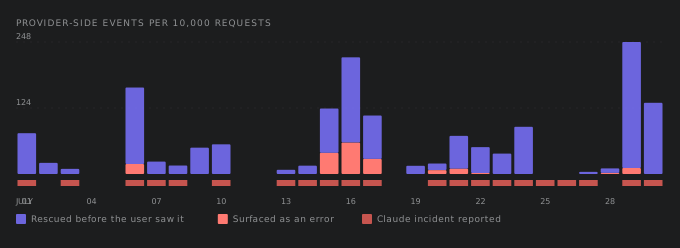
Figure 7 · Provider load
Provider-side events per 10,000 requests, split by whether the user saw them, Claude incident days marked beneath
60 of the 61 failures that surfaced fell on a day Anthropic had already declared an incident - the lone exception is one Cloudflare 520 on 28 July. 94% of the rescues did too.
The correlation above makes this undeniable. Based on public records when Claude was struggling in Figure 1, our logs land on top of it and clearly show the system averted user harm and kept them in the flow.
The recovery layer caught 89.5%
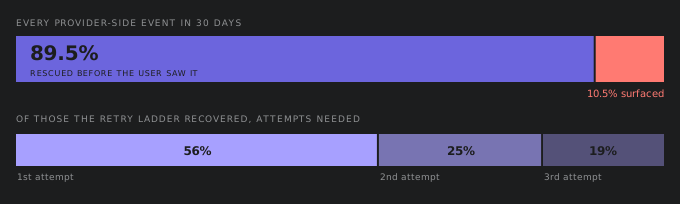
Figure 8 · Absorption
Every provider-side event in the period, by outcome, lower panel shows attempts needed
Without the recovery layer, users would have met roughly 62 provider failures per ten thousand requests instead of 6.5 - nine and a half times as many. And 44% of retry recoveries needed more than one attempt: had we stopped after the first, we would have dropped nearly half of what the ladder saved.
That is how we have built the defence that works. It does not make provider failure disappear. It moves nine failures in ten out of the user's view, and it degrades gracefully rather than cliff-edging when Claude is having a bad day.
06 - The real lesson
Reliability at the application layer is not about achieving uptime your provider cannot give you. It is about ensuring the gap between the headline number and the lived experience is absorbed by your architecture rather than handed to your users.
The teams that get this right treat provider degradation as a normal operating condition - designed for, tested against, instrumented, rather than an incident to be surprised by. Retries with backoff, response validation, state repair, configurable routing, and clear error messages are the details people miss and where DinoAI excels.
See DinoAI on your own dbt™ project.
If you are building your own agents, this is where teams struggle to go from a internal POC to production. Luckily, you can bring your own agents and we take care of the infrastructure and devops.
Paradime connects to your warehouse and your code base. The first agent-built PR usually is live in an hour and you can go to production the same day.
Sign up on Paradime for free and start building your first agents and pipelines for data work.
Notes
Method. Every figure on this page draws on Anthropic's published incident history for 4 May – 30 July 2026, exported from status.claude.com: 142 incidents, complete, with no retrieval gaps. Durations use the impact windows Anthropic states. Four incidents carry a single timestamp rather than a range; they are drawn as ticks and excluded from duration statistics rather than assigned an invented length. The 18.8-day Mythos 5 / Fable 5 access suspension is excluded from every figure - it was a policy action under export controls - leaving 141 incidents charted.
Model attribution in Figure 5 is parsed from incident titles, so an incident naming several models counts once against each; 46 incidents name no model. Monthly figures in Figure 3 are normalised per calendar day because the window opens on 4 May and closes on 30 July, making neither month complete. Figure 6 describes DinoAI's architecture and is not a measurement.
Figures 7 and 8 draw on 30 days of DinoAI request logs, 1–30 July 2026, bucketed to midnight Pacific and matched against the status export on the same boundary. Only provider-side failures are counted — upstream overload, timeout and unknown. Client-side 4xx are excluded from the analysis entirely, on the grounds that they measure our own validation rather than provider health. Every axis is a rate or a share; no absolute request or error volumes are published. Request counts are used internally to derive per-10,000 rates and are never plotted.


