dbt™ Monitoring with Datadog: Send Pipeline Failures from Paradime
dbt™ monitoring with Datadog made simple: automatic incident creation from failed runs, severity mapping, commander assignment, and unified visibility across data pipelines and infrastructure.

Fabio Di Leta
·
6
min read

Route dbt™ failures straight to Datadog and track pipeline breaks alongside your infrastructure monitoring. Commander assignment, severity levels, customer impact flags—the works.
The Problem
3 AM. Your dbt™ model breaks. By 9 AM standup, dashboards are toast and nobody knows who's on it.
Data teams lose credibility in this gap between "broke" and "fixed." Alerts vanish into Slack black holes. Critical production failures look identical to flaky dev tests.
Wire Paradime to Datadog and failed runs become real incidents. Assigned. Tracked. Resolved.
What You Need
Paradime side:
Admin access
Bolt scheduler running
dbt™ schedules (existing or new)
Datadog side:
Account access
API Key
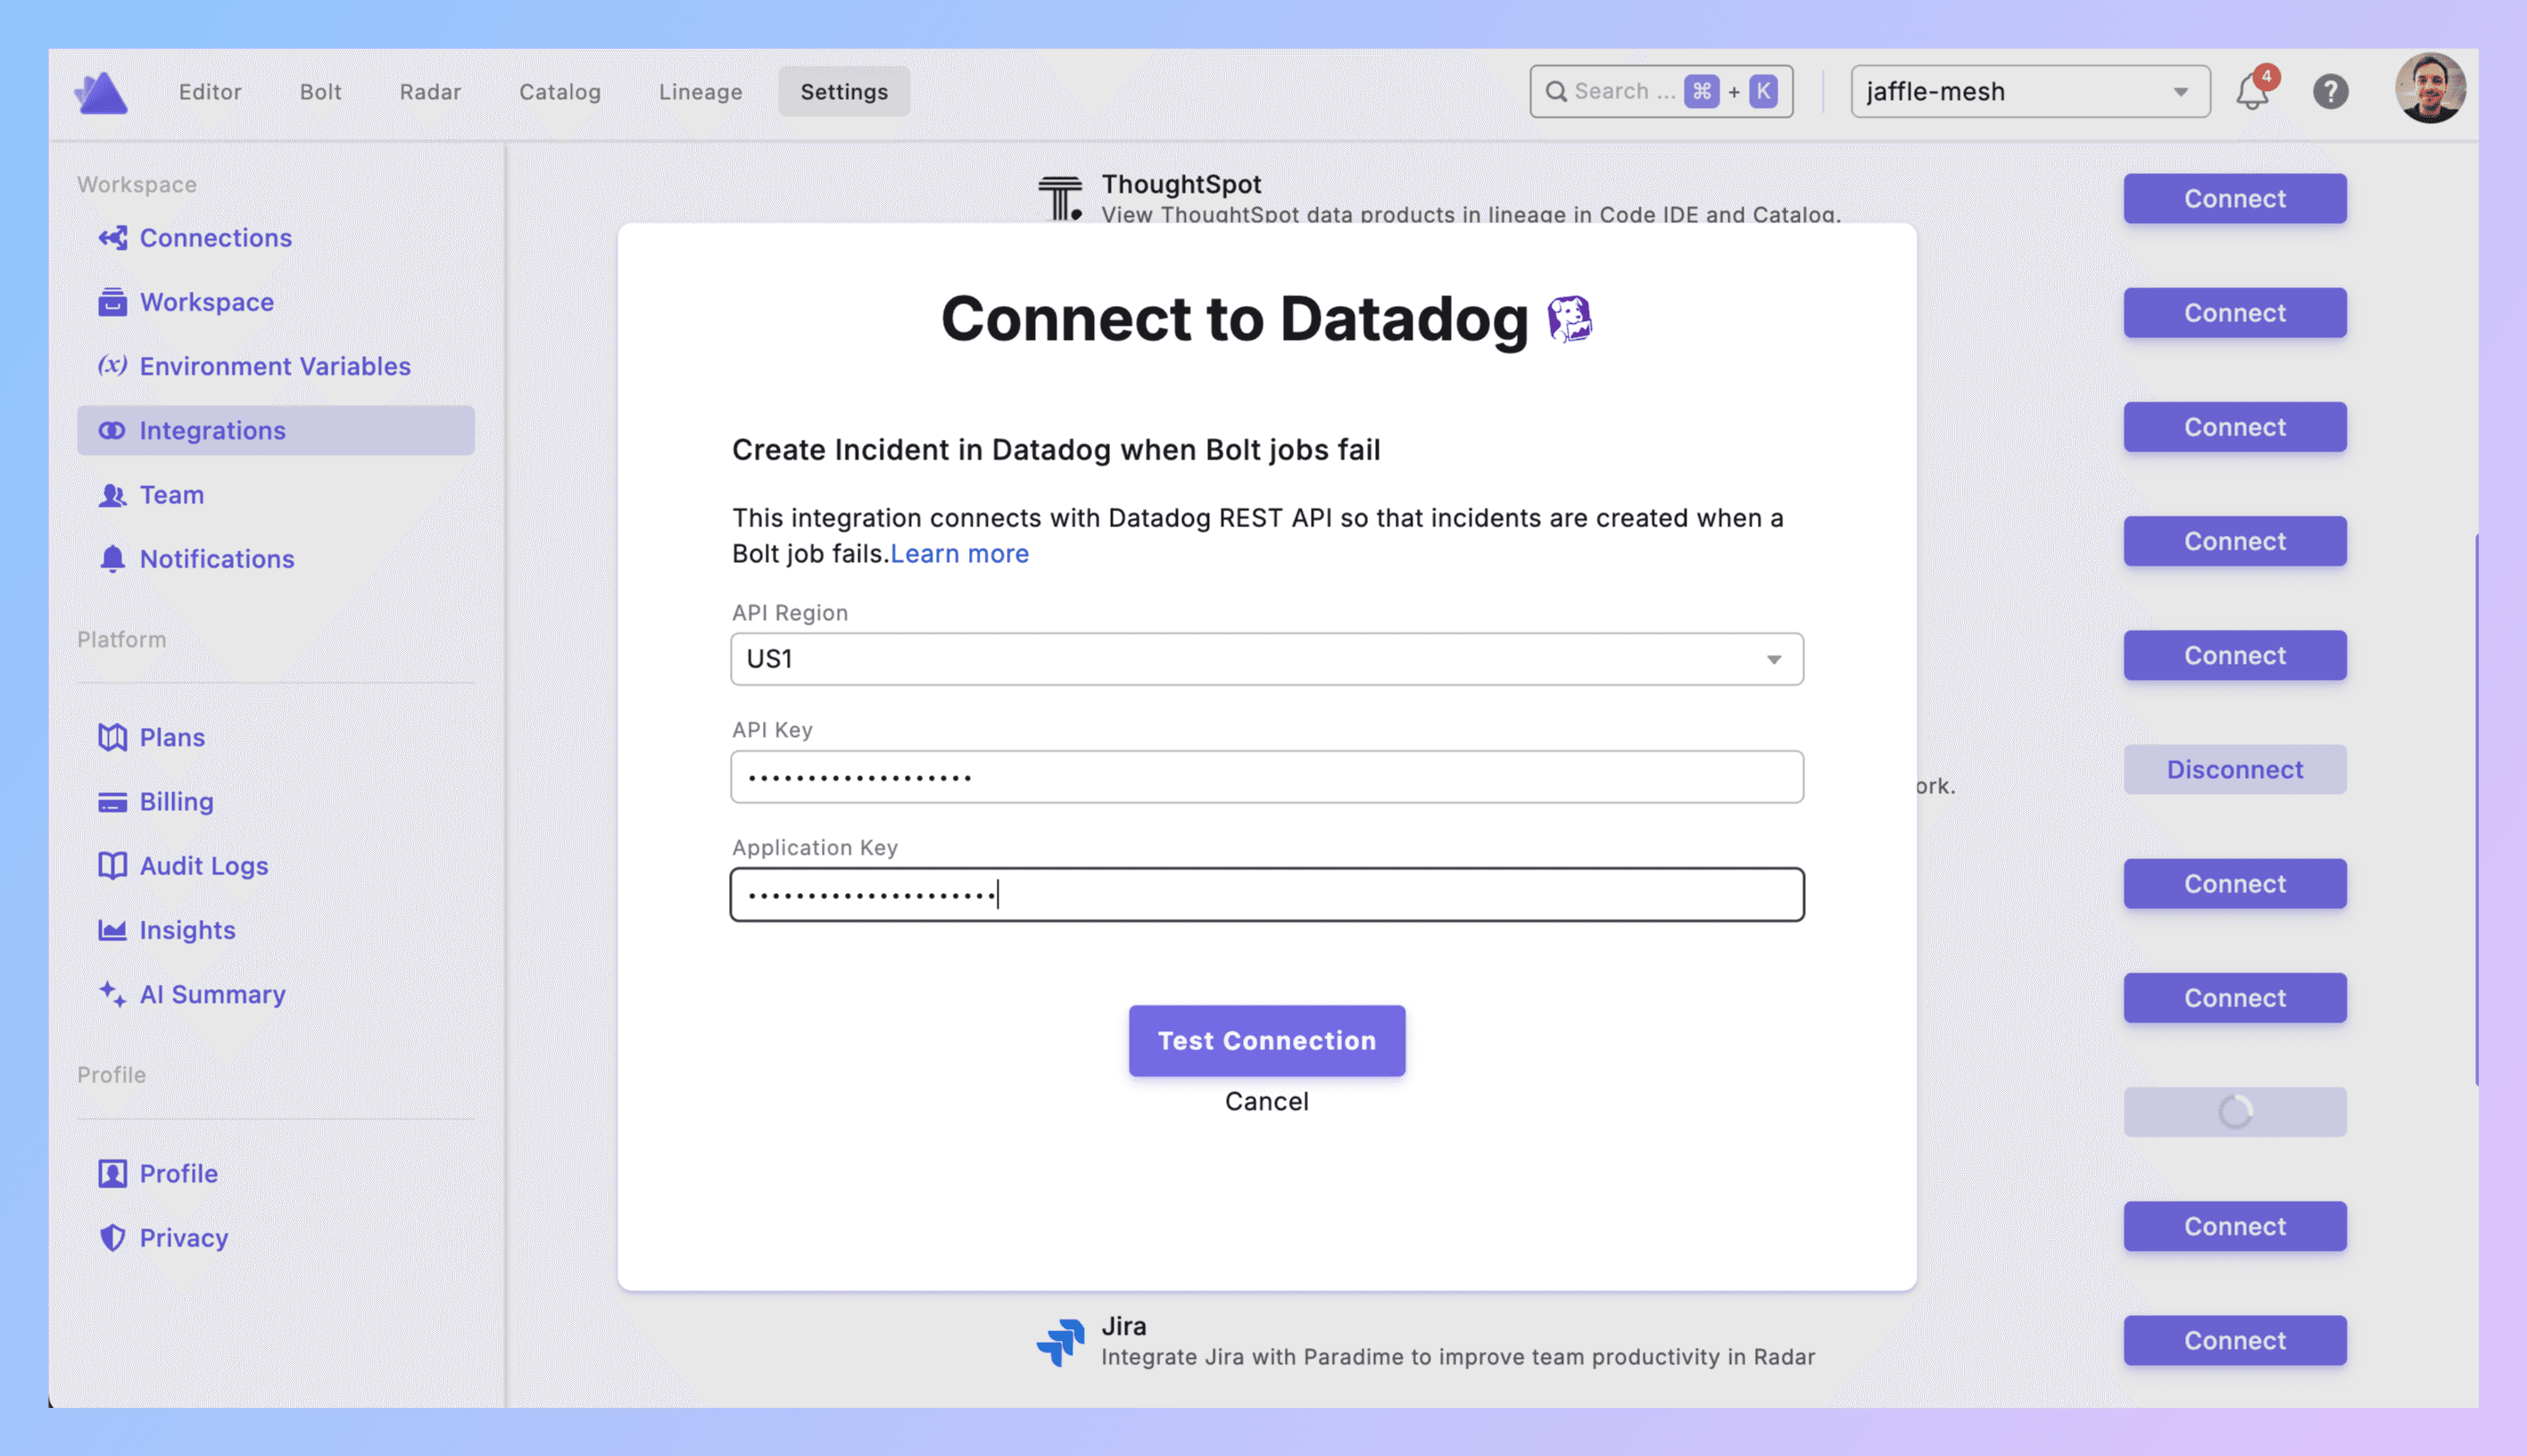
Application Key with these permissions:
incident_notification_settings_readincident_readincident_writeteam_readuser_access_read
How It Works
When Bolt detects a failure, it hits Datadog's API. Incident gets created with your parameters, commander gets assigned, notifications fire. No manual tickets.
Setup
1. Grab Your Datadog Keys
Get your API key: Datadog API key docs
Get your Application key: Datadog Application key docs
Verify the Application key has all five permissions listed above.
2. Connect to Paradime
Paradime → Settings → Integrations → Datadog
Pick your API region. Paste both keys. Click Create.
Connection shows green? Good.
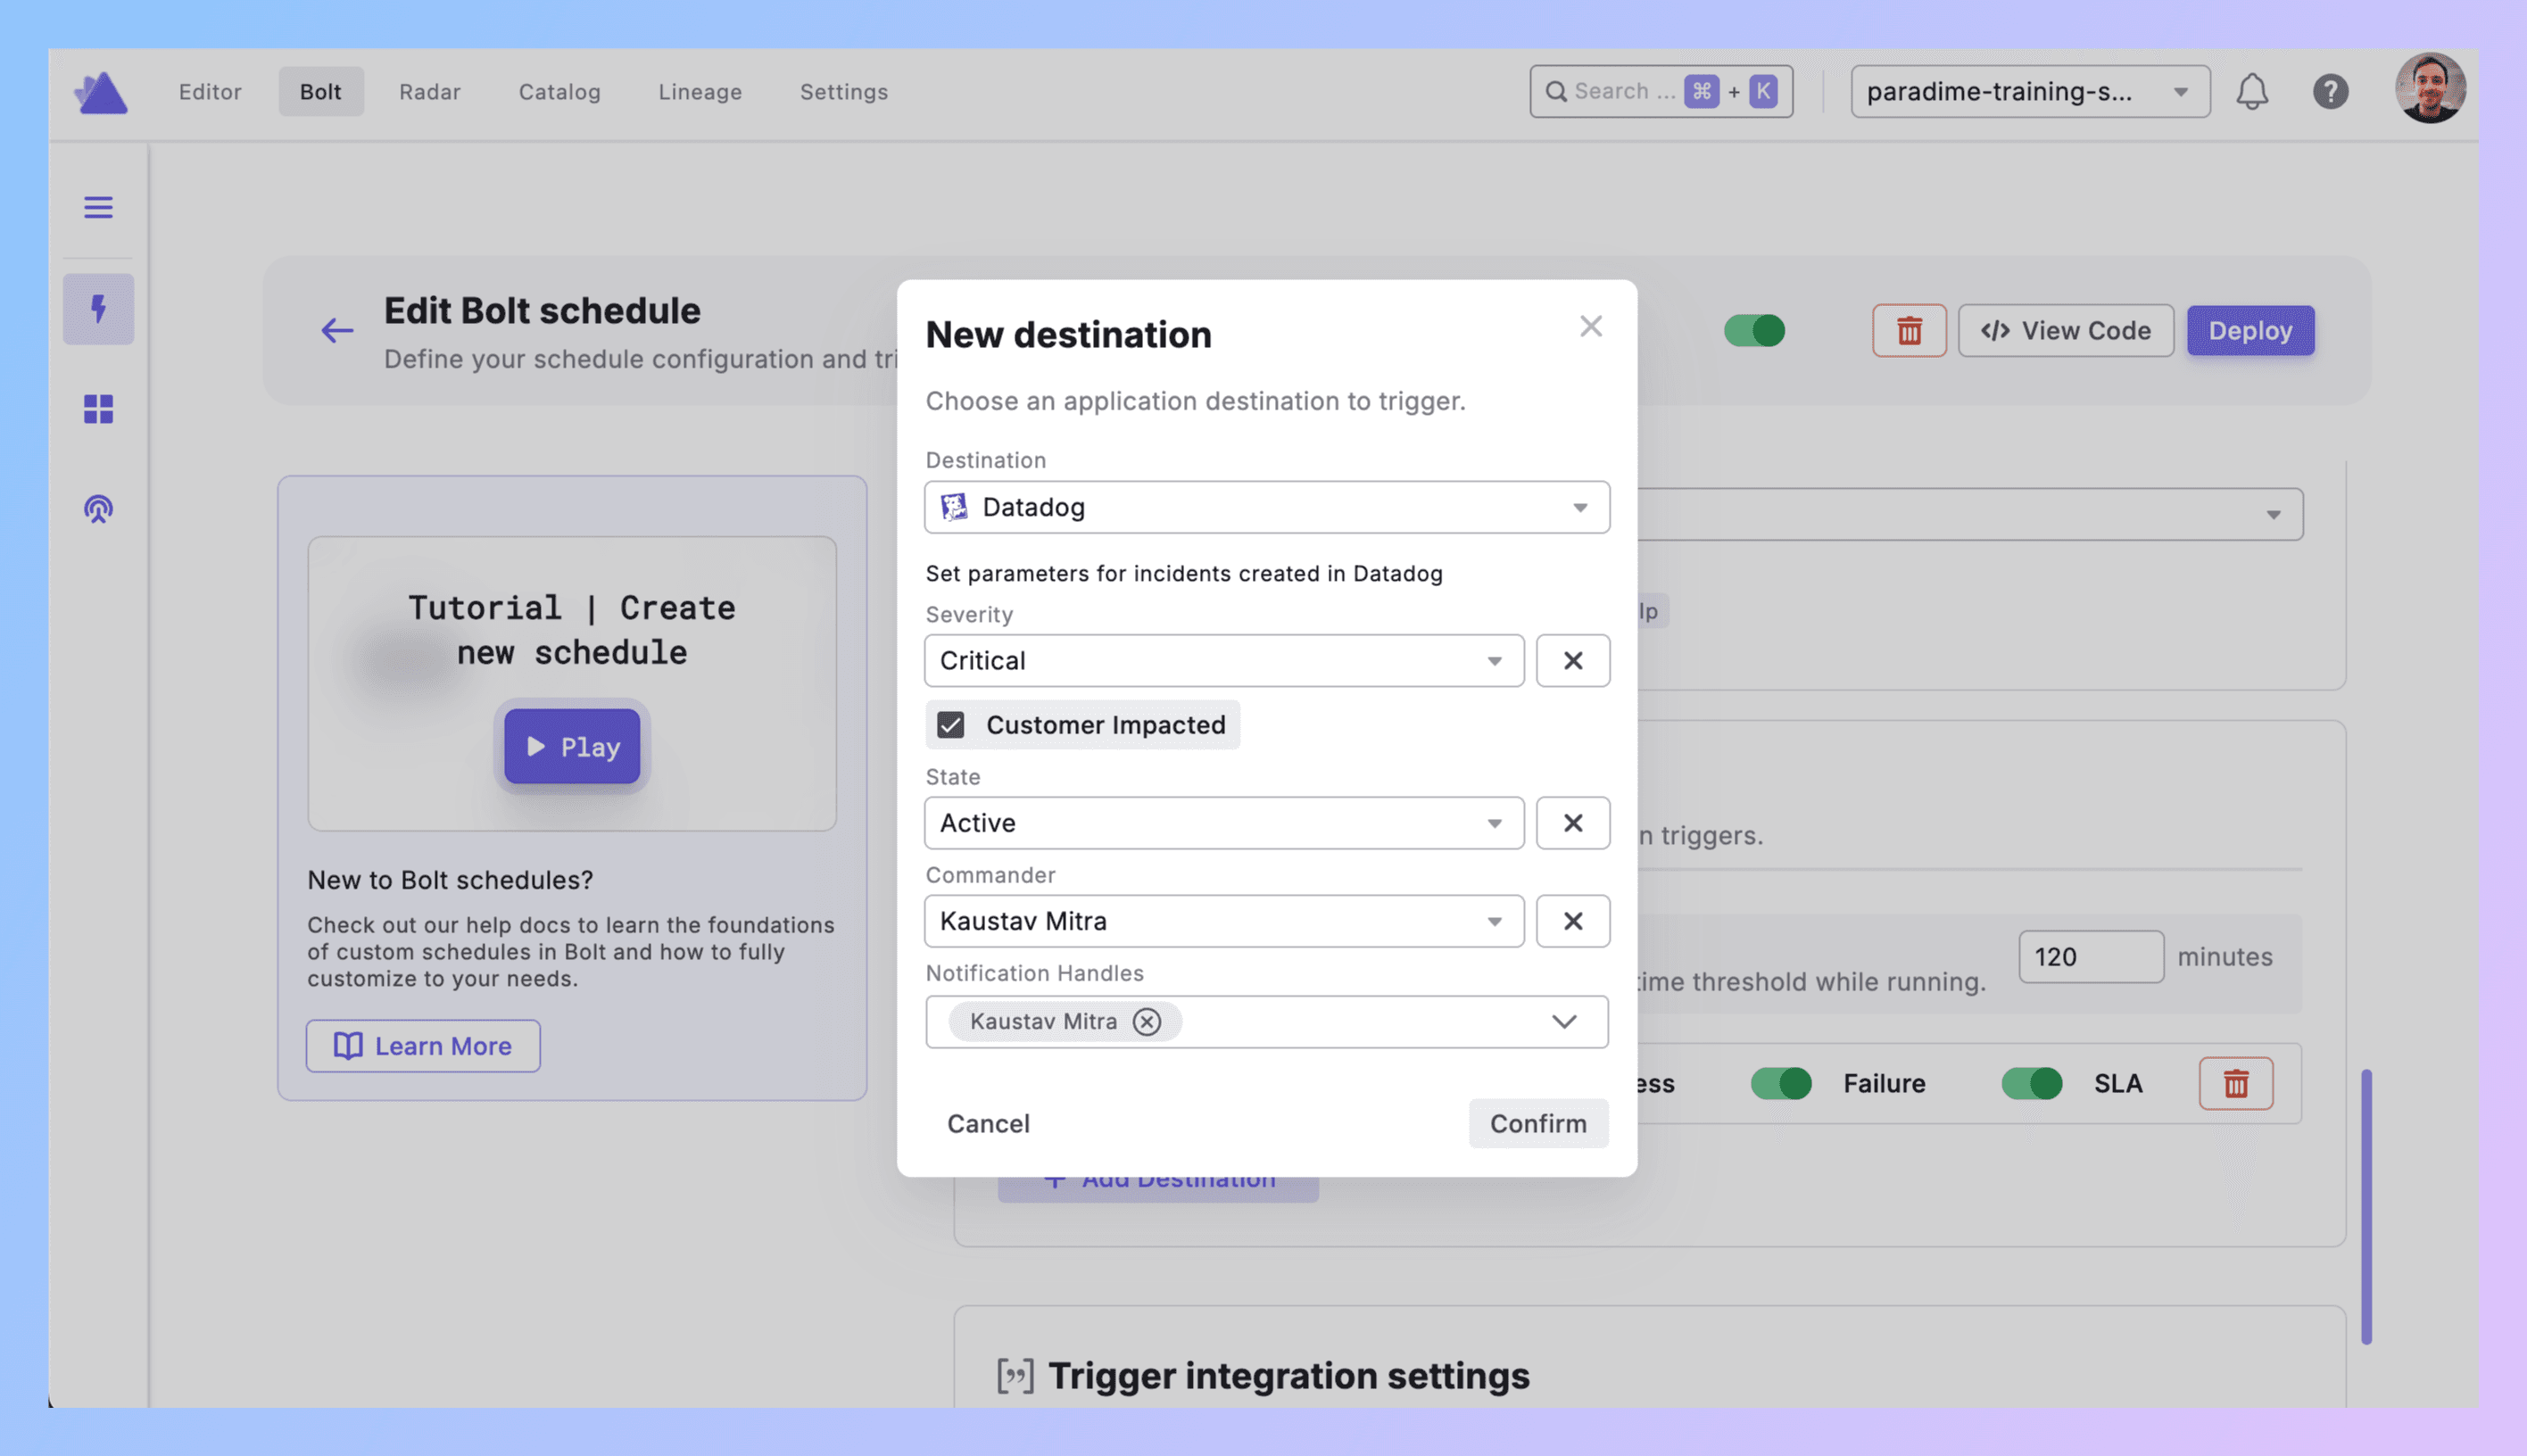
3. Add Trigger to Schedule
**Bolt → Schedules** → grab an existing schedule or make a new one.
Set your dbt™ commands (dbt run --select tag:critical or whatever).
Scroll to Triggers integration → Add Integration → Datadog
4. Configure the Incident
Severity: How bad is it?
Critical = pipeline down, customers affected
High = important model failed, impacts stakeholders soon
Medium = matters but not urgent
Low = nice to know
Customer Impacted: Check the box if this breaks customer-facing stuff. Don't check it for internal analytics that nobody external sees.
State: Start with Active. Datadog will let you move it to Stable or Resolved later.
Commander: Pick who owns this. Usually your on-call data engineer.
Notification Handles: Who else needs to know? Finance team for revenue pipelines. Product for feature metrics. Keep it relevant.
Hit Confirm.
5. What Gets Created
Bolt run fails → Datadog incident appears with:
Title showing schedule and workspace
Direct link to Paradime run logs
Run ID, timestamps, commands, branch
AI summary of what broke
Your severity/state/customer impact settings
Commander assigned, notifications sent
6. Test It
Make a test schedule. Break it on purpose (reference fake_table that doesn't exist).
Run it.
Check Datadog. Incident should be there with all your settings.
Check notifications. Commander and handles should've gotten pinged.
Click the Paradime link. Should take you straight to logs.
Debugging:
No incident? API keys wrong or permissions missing.
Wrong severity? Check your config.
Nobody notified? Handles not set correctly.
7. Production Rollout
Add triggers to all schedules that matter. Use severity levels that match actual impact.
Write down what Critical vs High vs Medium means for your team. Share it.
Best Practices
Severity discipline. Not everything is Critical. Revenue pipeline serving live dashboards = Critical. Internal forecast model that runs daily = High or Medium. Over-alerting kills the signal.
Scope smart. Running dbt build on your entire project in one schedule? Don't. Split critical paths from experimental stuff. Tag models. Use --select. Control what creates incidents by controlling what runs together.
Customer impact means customer impact. Internal analytics for your ops team? Not customer-impacted. Data feeding your product's recommendation engine? Customer-impacted. Be honest.
Commander rotation. Spread the load. Don't always assign the same person. If Datadog has on-call scheduling, use it.
Notify strategically. Finance team doesn't need alerts about marketing attribution model failures. Product doesn't care about internal expense reporting pipelines. Target your notifications.
Use the unified view. This is the point of Datadog. Data pipeline failures now show up next to your API errors, database slowdowns, infrastructure incidents. Correlate them. "Oh, dbt™ failed because the warehouse was overloaded."
Send dbt™ run metrics to Datadog. Beyond just incidents, use Datadog dashboards for dbt™ models to track run duration, model count, test pass rates. Set up alerts for data pipelines that catch issues before they become incidents.
Real Example
11:47 PM - dbt run --select tag:revenue_reporting kicks off.
11:52 PM - fct_daily_revenue crashes. Schema changed in raw_payments.
11:52 PM - Trigger fires.
11:53 PM - Datadog incident INC-789 created:
"dbt™ Production Failed - Revenue Reporting"
Severity: Critical
Customer Impacted: Yes
Commander: Sarah (on-call)
Notifications: Sarah, finance lead, analytics manager
Logs linked
AI summary: "Column mismatch in raw_payments broke fct_daily_revenue"
12:02 AM - Sarah clicks through to Paradime. Sees the schema change.
12:15 AM - Updates the model. Commits. Reruns.
12:22 AM - Success. Updates Datadog to "Stable." Notes: "Fix deployed, backfilled."
12:25 AM - Marks "Resolved."
Next day - Team reviews the timeline. Adds schema drift detection to raw_payments tests.
Get Started
Test schedule. Break it. Watch Datadog catch it.
Define severity levels. Write them down.
Add trigger to one prod pipeline. Run it for a week.
Expand to everything critical.
Links:


