dbt™ Monitoring in New Relic: Track Pipeline Health from Paradime
dbt™ monitoring in New Relic: track data pipeline health alongside application and infrastructure monitoring with automatic incident creation, environment tagging, and unified observability dashboards.2 / 2

Fabio Di Leta
·
6
min read

Send dbt™ failures straight to New Relic and monitor data pipelines alongside your application stack. One observability platform for everything.
The Problem
You're already using New Relic for application monitoring. APM, infrastructure, logs, the whole stack. But your data pipelines? Those fail in a vacuum.
When a dbt™ model breaks, it's invisible to your observability setup. Your warehouse workloads show up nowhere. Data team scrambles while the rest of engineering has full visibility into their systems.
Wire Paradime to New Relic and data pipeline incidents flow into the same platform as everything else. Track data pipeline health in New Relic alongside API response times and database queries.
What You Need
Paradime:
Admin access
Bolt scheduler running
dbt™ schedules configured
New Relic:
Admin access
Account ID
API Key
How It Works
Bolt calls New Relic's API when runs fail. Incidents show up in your New Relic dashboard with full context—run logs, timestamps, AI summaries.
Setup
1. Get New Relic Credentials
Find your Account ID:New Relic Account ID docs
Generate API Key:New Relic API Keys docs
Save both. You'll need them.
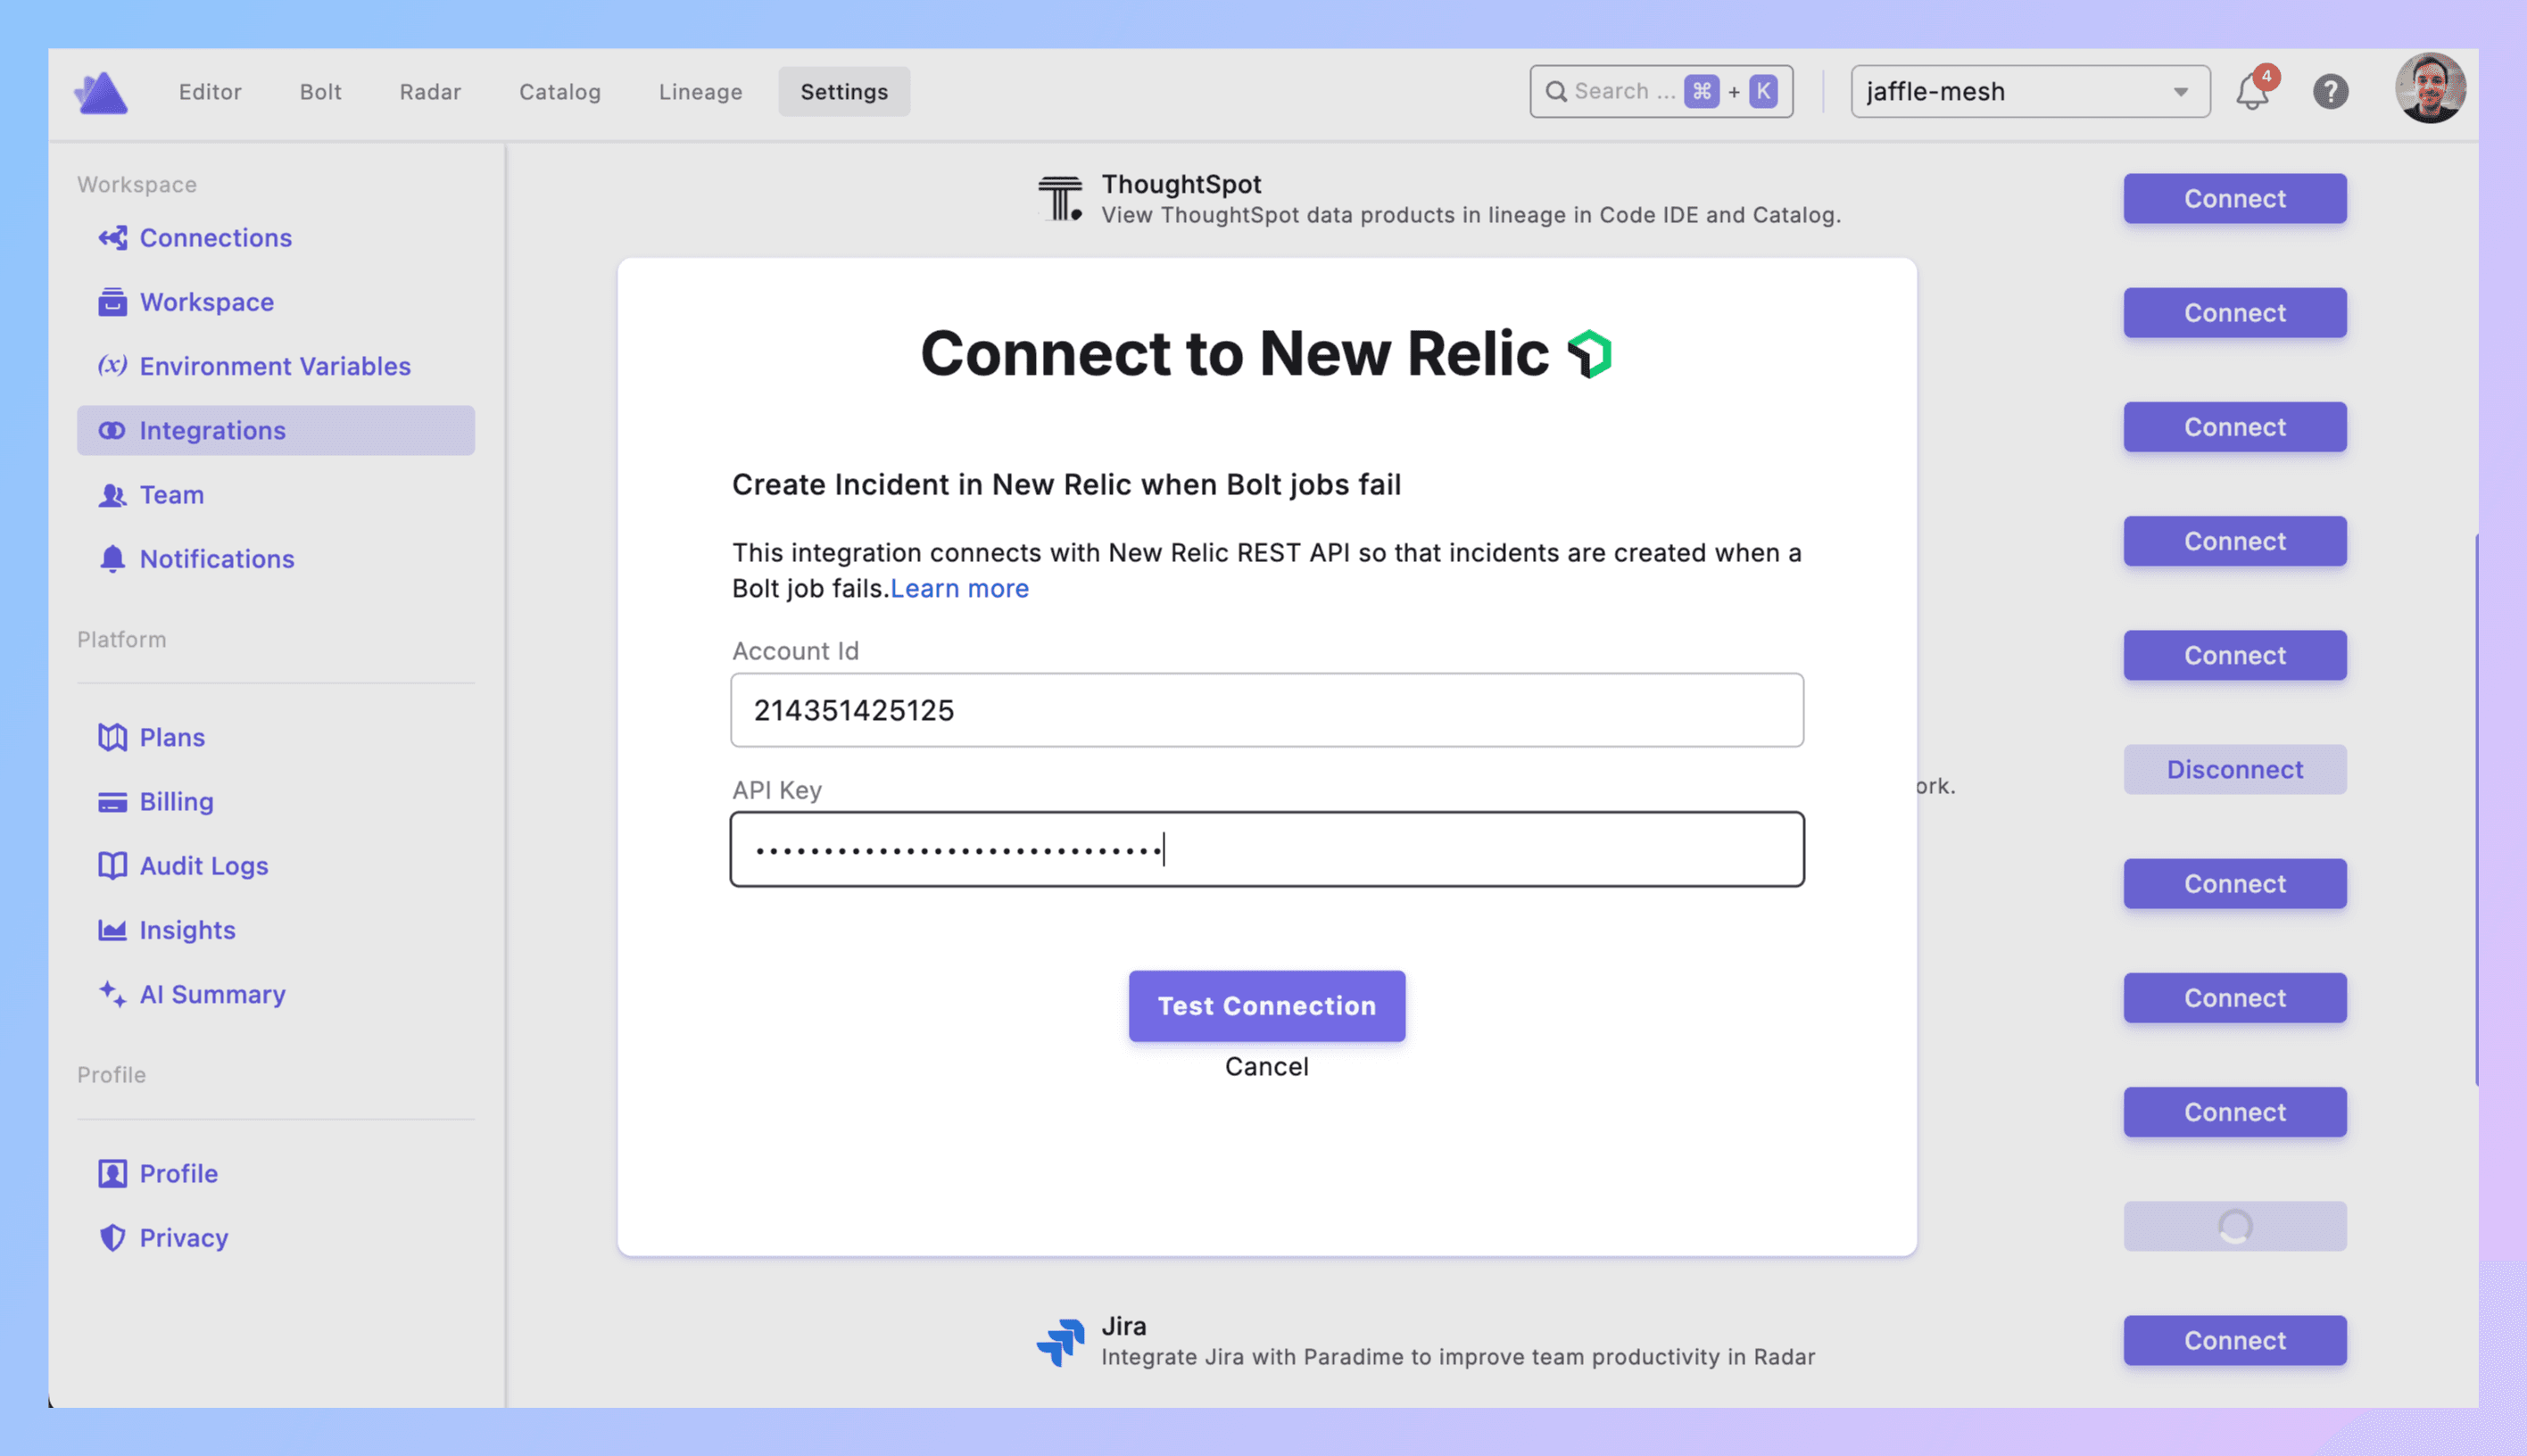
2. Connect to Paradime
Paradime → Settings → Integrations → New Relic
Paste Account ID. Paste API Key. Click Create.
Connected? Good.
3. Add Trigger to Schedule
**Bolt → Schedules** → pick your schedule.
Set dbt™ commands (dbt run --select tag:critical).
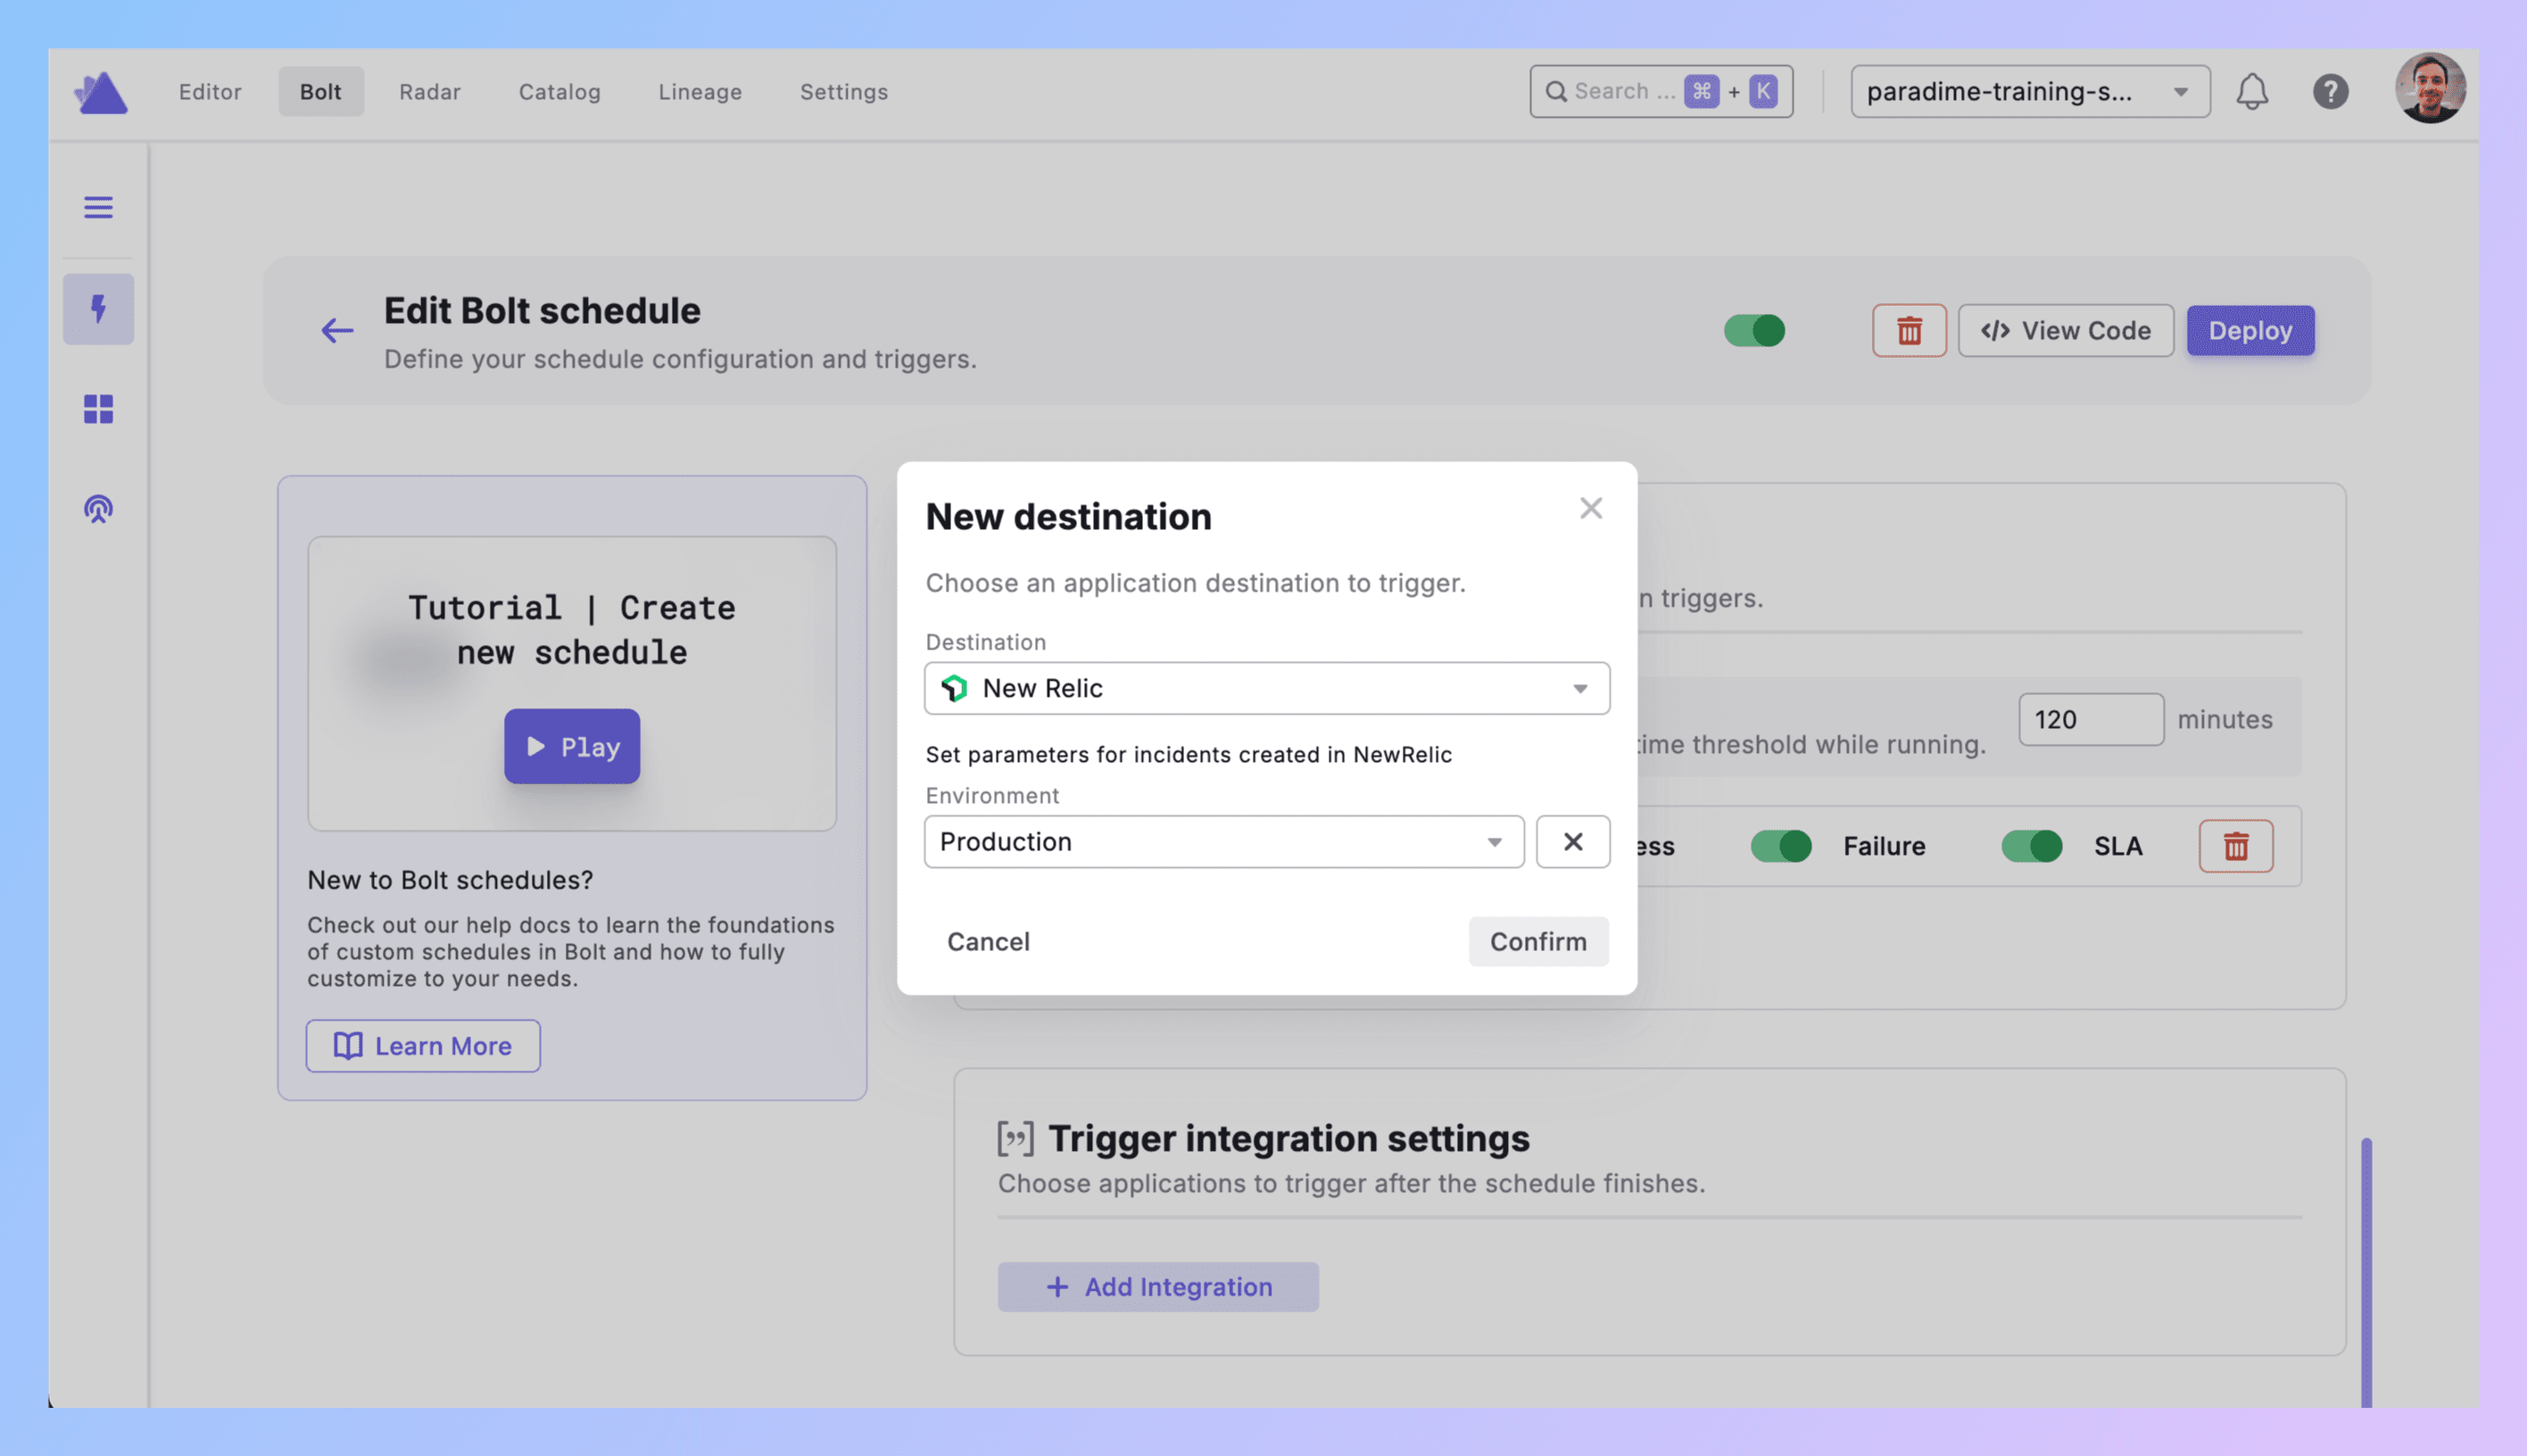
Triggers integration → Add Integration → New Relic
4. Configure Environment
Environment: Production, Staging, Development, or custom.
This tags the incident in New Relic so you can filter by environment. Production failures show up differently than dev noise.
Click Confirm.
5. What Gets Created
Run fails → New Relic incident with:
Title (schedule name, workspace)
Direct link to Paradime run logs
Run ID, timestamps, commands
Branch info
AI summary of the failure
Environment tag
6. Test It
Test schedule. Break it (SELECT * FROM table_that_doesnt_exist).
Run it.
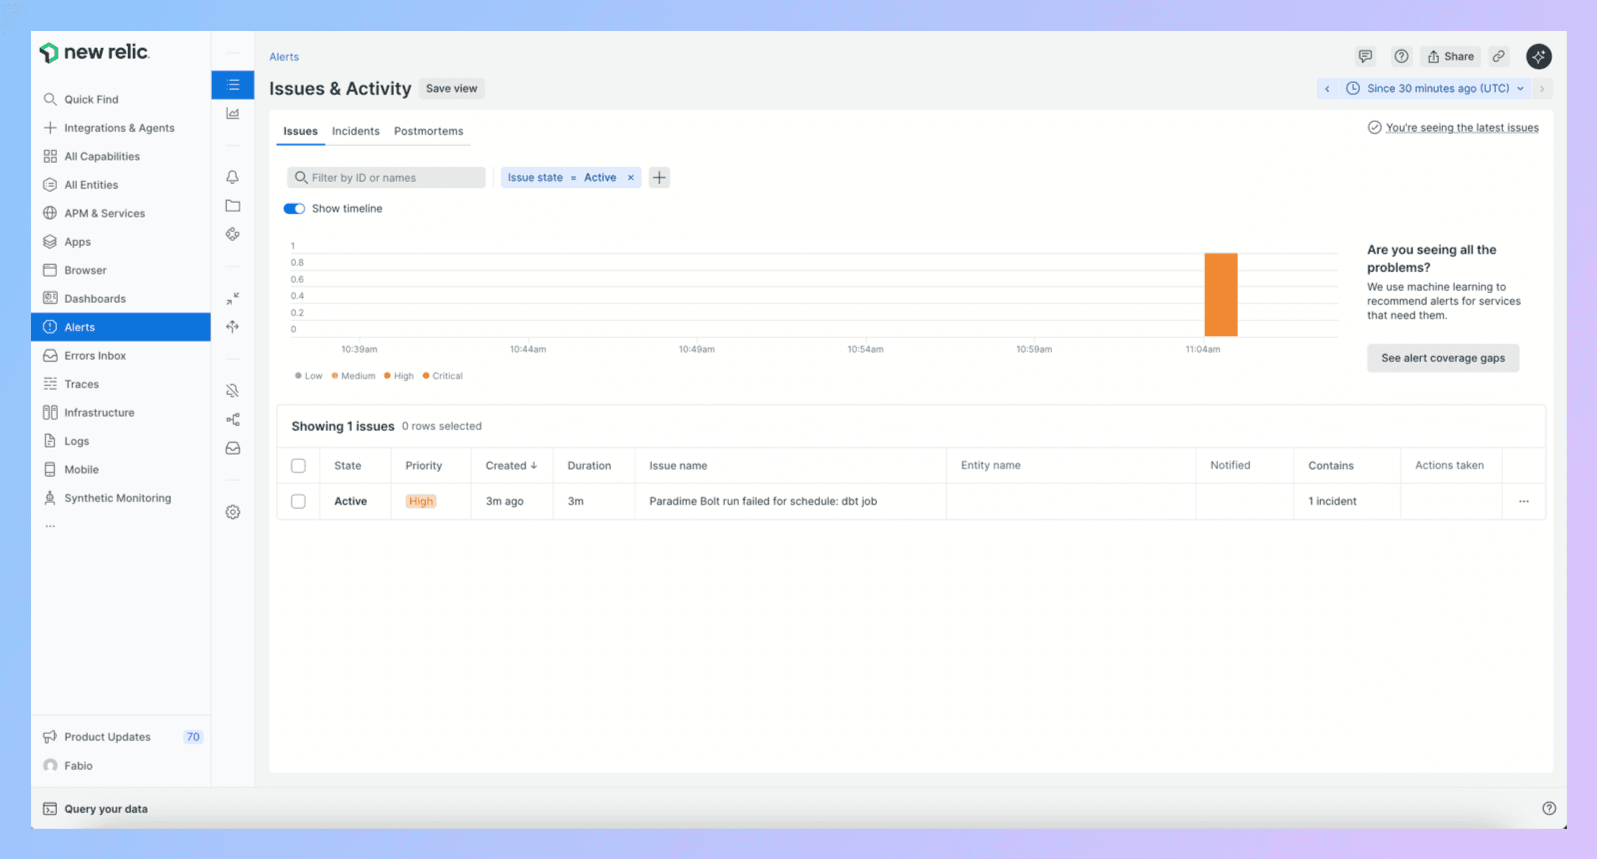
Check New Relic. Incident should be there under your configured environment.
Click the Paradime link. Should go straight to logs.
Debugging:
No incident? API credentials wrong.
Wrong environment? Check your trigger config.
Missing details? New Relic API might be rate limiting.
7. Production Rollout
Add triggers to critical schedules. Use environment tags correctly (Production for prod, not everything).
Best Practices
Use environments properly. Production = production. Don't tag dev runs as Production just because you're testing in prod. New Relic dashboards for warehouse workloads only work if you're honest about environments.
Leverage unified observability. This is the point. You already monitor your APIs, databases, infrastructure in New Relic. Now add data pipelines. Build dashboards that show:
API failures correlated with dbt™ failures
Warehouse query performance alongside pipeline runs
Infrastructure issues that might be breaking dbt™
Set up New Relic alerts for dbt™ failures. Beyond incidents, configure New Relic alert conditions on dbt™ incident creation. Route high-priority failures to PagerDuty. Route lower-priority to Slack. Use New Relic's alerting infrastructure you already have.
Track metrics across the stack. dbt™ monitoring in New Relic means you can correlate:
"Why did the warehouse slow down?" → Check if dbt™ ran a massive transformation
"Why did dbt™ fail?" → Check if the database had connection issues
"Why are API calls failing?" → Check if upstream data pipeline broke
Build New Relic dashboards for dbt™ models. Create custom dashboards showing:
dbt™ run frequency and duration
Failure rates by environment
Most frequently failing models
Pipeline health trends over time
Filter by environment. Production incidents need different SLOs than staging. Use environment tags to separate them in dashboards and alerts.
Integrate with existing workflows. Already routing New Relic incidents to Slack? dbt™ failures flow through the same channels. Already have on-call rotations? Same people get dbt™ incidents.
Real Example
10:15 PM - dbt run --select tag:product_metrics executes in production.
10:20 PM - fct_user_engagement fails. Upstream event tracking changed schema.
10:20 PM - Trigger fires.
10:21 PM - New Relic incident created:
Title: "dbt™ Production Failed - Product Metrics Pipeline"
Environment: Production
Details: Link to Paradime logs, run ID, timestamps
AI summary: "fct_user_engagement failed—event_type column missing from source table"
10:22 PM - DevOps engineer checking New Relic for unrelated API issue sees the data pipeline failure. Pings data team.
10:25 PM - Data engineer Jamie clicks Paradime link. Reviews logs. Sees schema change.
10:35 PM - Jamie adds defensive logic for missing columns. Reruns.
10:40 PM - Success. Marks incident resolved in New Relic.
Next morning - Platform team reviews New Relic dashboard. Sees correlation between event tracking deployment and dbt™ failure. Updates deployment checklist to notify data team of schema changes.
Get Started
Test schedule. Break it. Check New Relic.
Add trigger to production pipelines. Use Production environment tag.
Build a New Relic dashboard showing dbt™ health alongside your other systems.
Set up alerts for critical pipeline failures.
Links:


